Figures & data
Figure 1. Distribution of sampling sites within the greater Boston metropolitan area
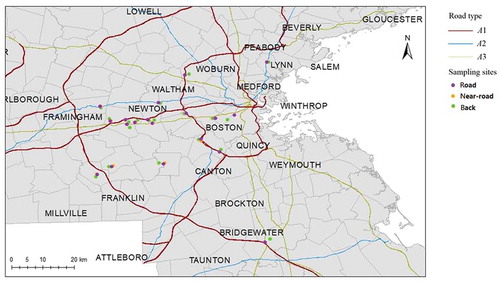
Figure 2. Mass fractions of Ba, Ca, Cu, Fe, Zn and Zr at different distance ranges
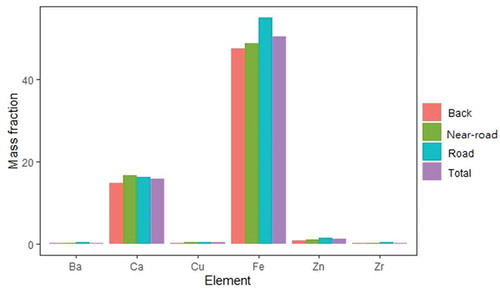
Table 1. Regression coefficients of log road distance for each of the trace elements in PM10 and PM2.5 from road dust
Figure 3. The relationship between log value of relative mass fraction decreases for elements in PM10from road dust and the perpendicular distance from the nearest A12 road in warm season. (a) Fe, (b) Ti, (c) Cu, (d) Zn, (e) Zr, (f) Ba
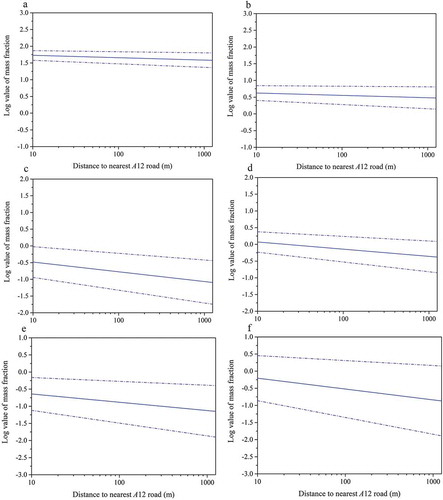
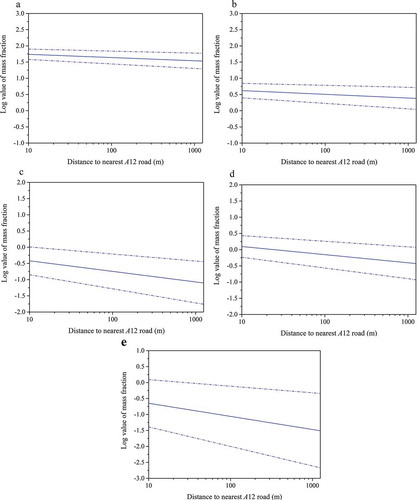
Figure 4. The relationship between log value of relative mass fraction decreases for elements in PM2.5from road dust and the perpendicular distance from the nearest A12 road in warm season. (a) Fe, (b) Ti, (c) Cu, (d) Zn, (e) Zr