Figures & data
Table 1. Comparison of methods for collecting on-road parameters for MC
Figure 1. Principle diagram of the data logging device
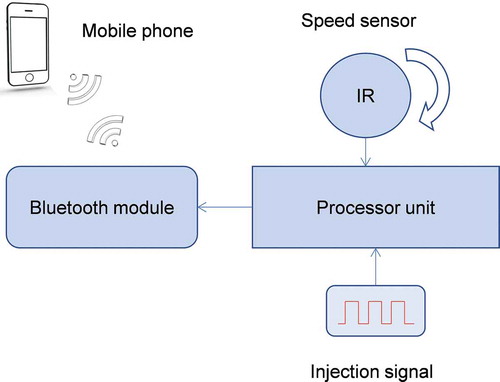
Figure 2. Schematic diagram of wheel rotational speed measurement (a) and the sensor installed on the test vehicle (b)
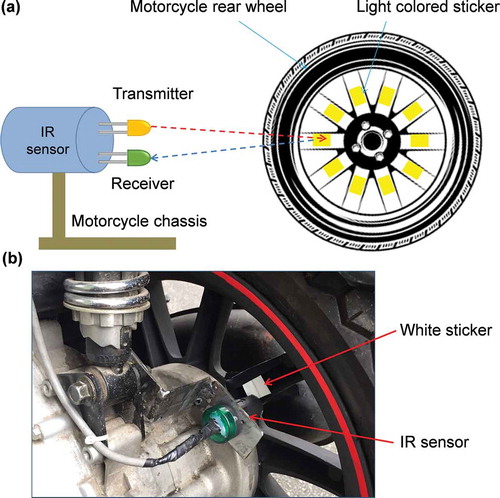
Figure 3. Flowchart of measuring instantaneous speed
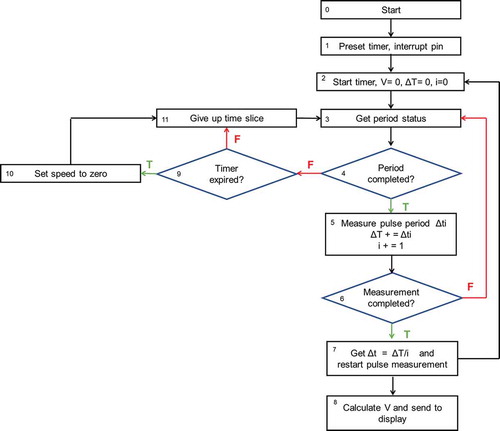
Figure 4. Principle of fuel consumption measurement
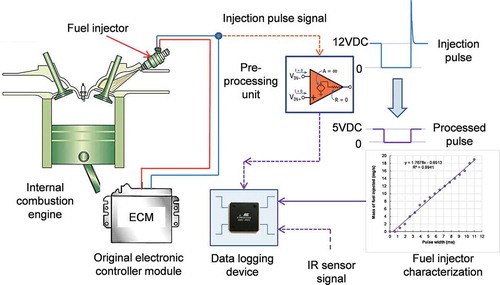
Figure 5. Flowchart of measuring instantaneous fuel consumption
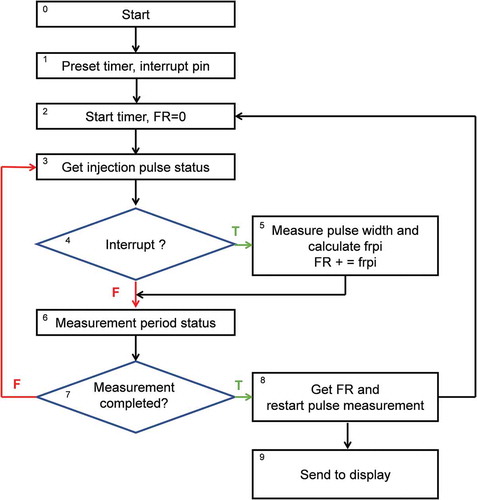
Figure 6. Experimental diagram for determining characteristics of injector
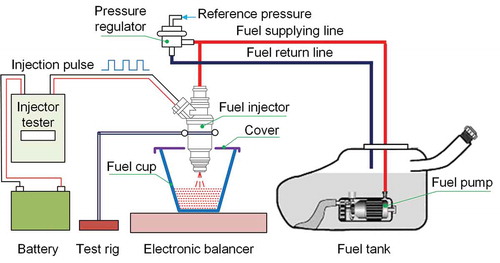
Figure 7. Relationship between the fuel rate and the injection duration
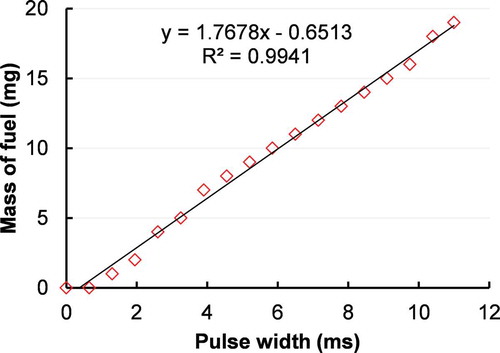
Figure 8. The application installed mobile phone and the driver aid computer in laboratory test
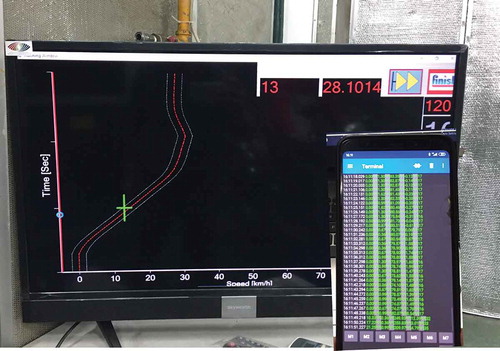
Figure 9. Flowchart of filtration process
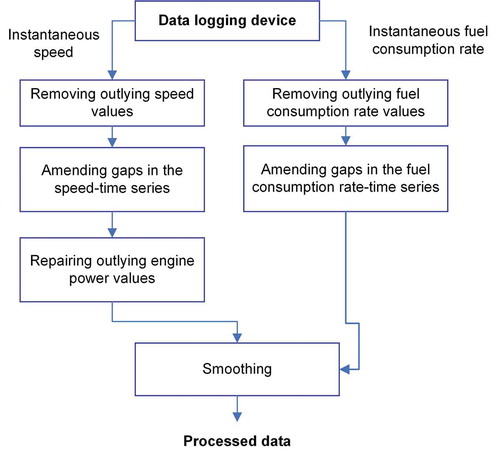
Figure 10. Flowchart of robust smoothing algorithm of data with missing values
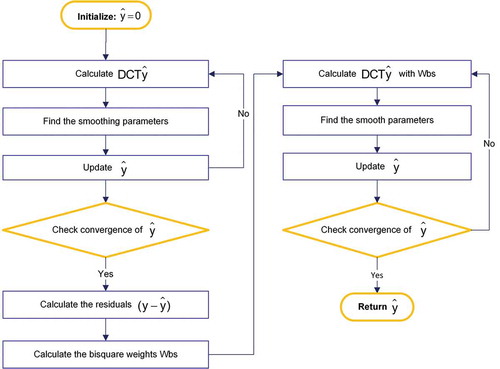
Table 2. Specifications of the test motorcycle
Table 3. Filtration limits
Figure 11. Illustration of detecting and repairing the outlying data
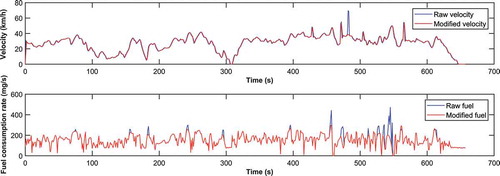
Figure 12. Illustration of the filter effectiveness. (a) Comparison collected data between with and without removing outliers before smoothing. (b) Comparison collected data between with and without final smoothing
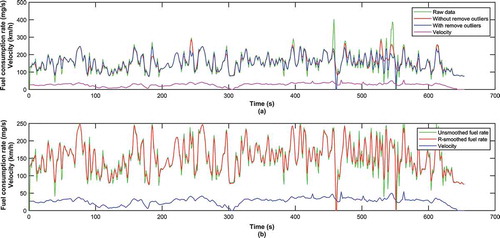
Figure 13. Comparison between different filter methods
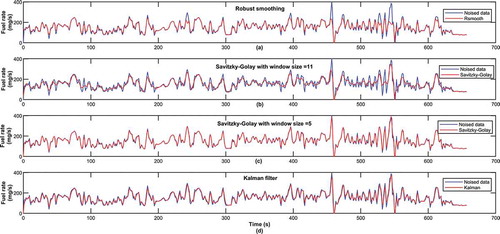
Table 4. Filtration results
Table 5. Comparison of the raw and processed data
Figure 14. Comparison of the frequency distribution of the speed–fuel consumption rate
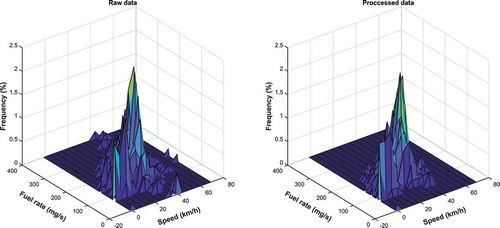
Figure 15. The correlation of measured speed with the chassis dyno
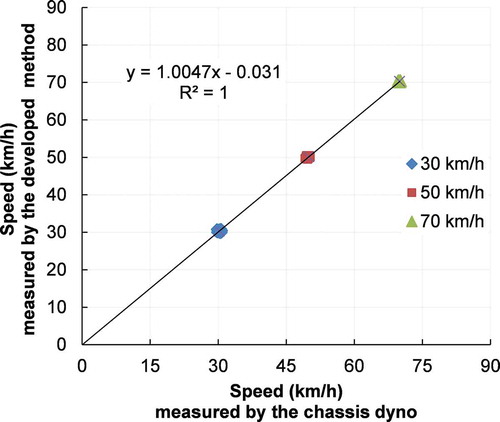
Figure 16. Comparison of speed measured by developed device and chassis dynamometer
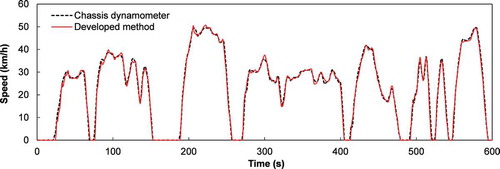
Figure 17. The correlation between two datasets of fuel consumption rate
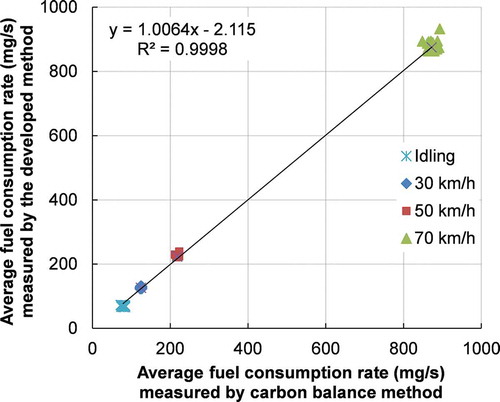
Figure 18. The comparison of the signal update ability of the instantaneous fuel consumption rate between two methods
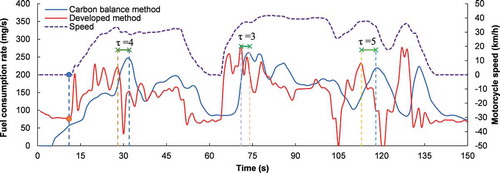
Figure 19. The correlation of measurements of fuel consumption rate between two methods
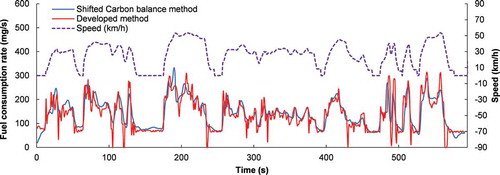
Figure 20. Example of measurement of real time fuel consumption with rapid acceleration and brake
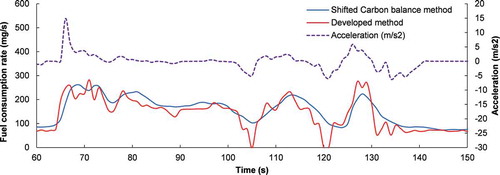
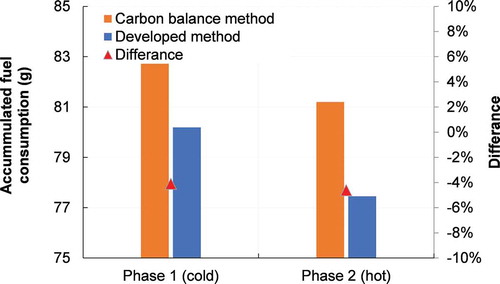
Table 6. The summary of measured emission and fuel consumption by two methods
Figure 21. Comparison of accumulated fuel consumption measured by two methods