Figures & data
Figure 1. General schematic of oxidized and reduced nitrogen chemistry in the troposphere. Compounds that are most important to daytime and nighttime chemistry are in red and black, respectively
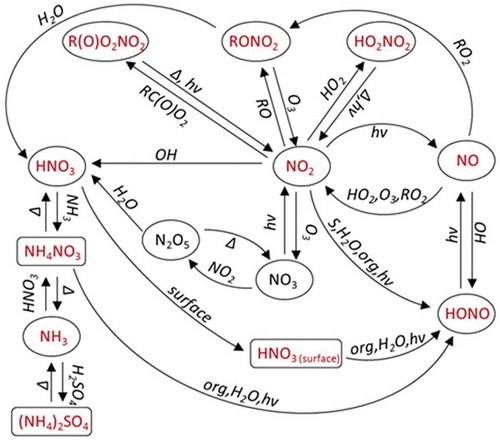
Table 1. Instrument information for the QC and PSP speciated NOy measurements
Figure 2. Map of the northeast United States with the Queens College (QC, black star) and Pinnacle State Park (PSP, blue star) sites indicated (adapted from D-Maps (Citation2018))
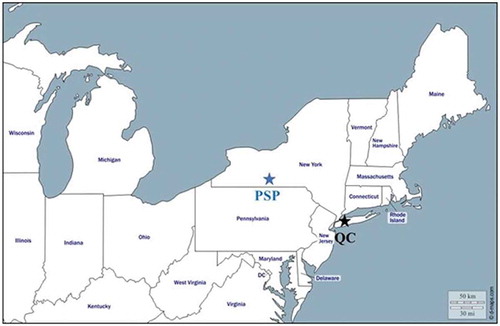
Table 2. Estimated method detection limit (MDL) and overall uncertainty for each measured NOy species. The estimated MDLs and overall uncertainties apply to hour-averaged data
Table 3. All-season median NOy speciation, p-values for the seasonal median NOx, HNO3, pNO3, PNs, and ANs concentrations that were determined using an analysis of variance (ANOVA) statistical method, and all-season median NOy partitioning at QC and PSP
Figure 3. Seasonal median speciated (a) NOy concentrations and (b) NOz concentrations at QC from September 2016 to August 2018. Data that are 50%–75% complete (DJF 2017/8 pNO3; MAM 2018 PNs and ANs) and less than 50% complete (DJF 2017/8 PNs and ANs; MAM 2018 pNO3; JJA 2018 HNO3) are denoted by the red and purple hatching, respectively. (c) Seasonal median NOy partitioning at QC from September 2016 to August 2018. The dashed red line denotes 100% closure of the NOy budget, and the x-axis is color-coded according to data usage. Reasons for missing data in (a) and (c) are outlined in the Methodology. See Table S1 for monthly numerical values and data completeness, respectively. In all figures, the combined uncertainty of the measurements is given by the black error bars
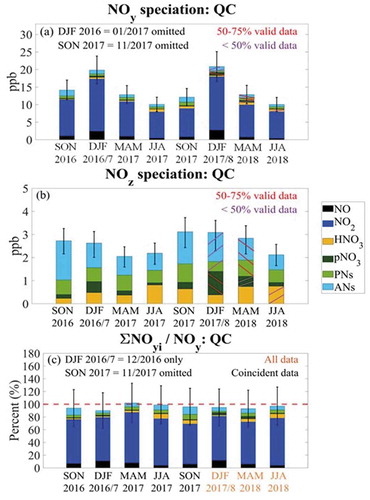
Figure 4. Seasonal median NOx/NOy ratio at QC from September 2016-August 2018. The dashed purple line denotes the median NOx/NOy ratio for the full measurement period. Reasons for missing data are outlined in the Methodology, and see Table S1 for monthly numerical values and data completeness, respectively. The combined uncertainty of the NO, NO2, and NOy measurements is given by the black error bars
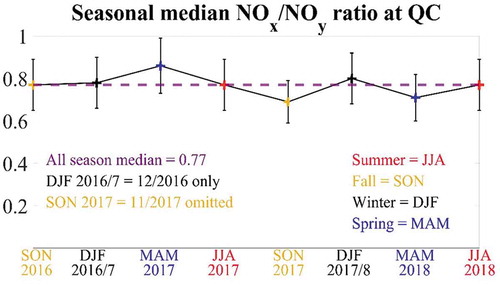
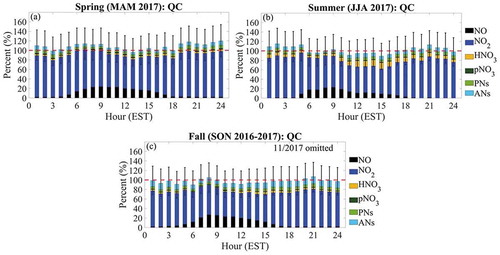
Figure 5. (a) The diurnal variation of the hourly median NOy speciation at QC during spring 2017. (b) The diurnal variation of the hourly median NOz speciation at QC during spring 2017. (c) Same as (a), except for summer 2017. (d) Same as (b), except for summer 2017. (e) Same as (a) and (c), except for fall 2016–2017. (f) Same as (b) and (d), except for fall 2016–2017. In all figures, the combined uncertainty of the measurements is given by the black error bars
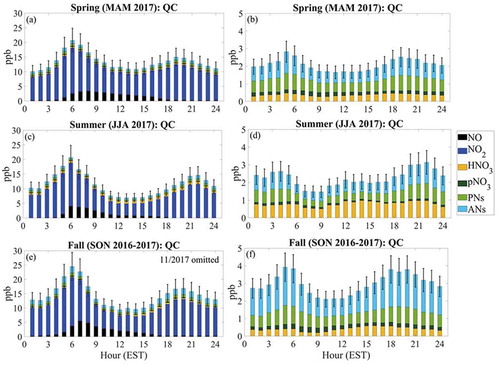
Figure 6. Seasonal median speciated (a) NOy and (b) NOz concentrations at PSP from June 2016 to August 2018. Data that are 50%–75% complete (MAM 2018 pNO3) are denoted by the red hatching. (c) Seasonal median NOy partitioning at PSP from June 2016 to August 2018. The dashed red line denotes 100% closure of the NOy budget, and the x-axis is color-coded according to data usage. Reasons for missing data in (a) and (c) are outlined in the Methodology. See Table S2 for numerical values and data completeness, respectively. In all figures, the combined uncertainty of the measurements is given by the black error bars
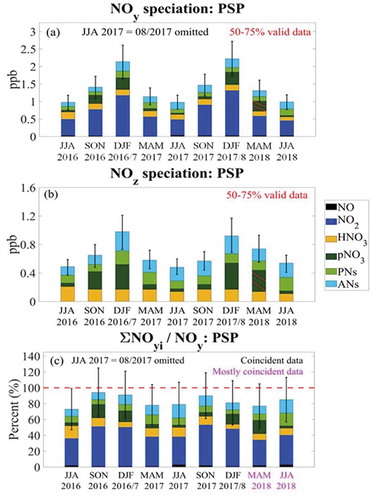
Figure 7. Seasonal median NOx/NOy ratio at PSP from June 2016 to August 2018. The dashed purple line denotes the median NOx/NOy ratio for the full measurement period. Reasons for missing data are outlined in the Methodology, and see Table S2 for numerical values and data completeness, respectively. The combined uncertainty of the NO, NO2, and NOy measurements is given by the black error bars
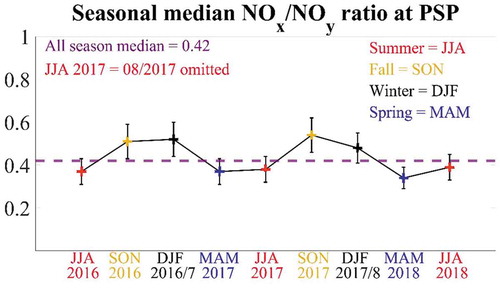
Figure 8. (a) The diurnal variation of the hourly median NOy speciation at PSP during spring 2017. (b) The diurnal variation of the hourly median NOz speciation at PSP during spring 2017. (c) Same as (a), except for summer 2016–2017. (d) Same as (b), except for summer 2016–2017. (e) Same as (a) and (c), except for fall 2016–2017. (f) Same as (b) and (d), except for fall 2016–2017. (g) Same as (a), (c), and (e), except for winter 2016/7–2017/8. (h) Same as (b), (d), and (f), except for winter 2016/7–2017/8. In all figures, the combined uncertainty of the measurements is given by the black error bars
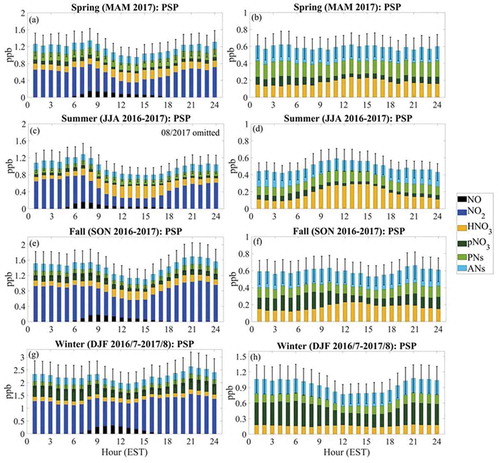
Figure 9. The diurnal variation of the hourly median NOy partitioning at PSP during selected seasons. The dashed red line denotes 100% closure of the NOy budget, and the combined uncertainty of the measurements is given by the black error bars
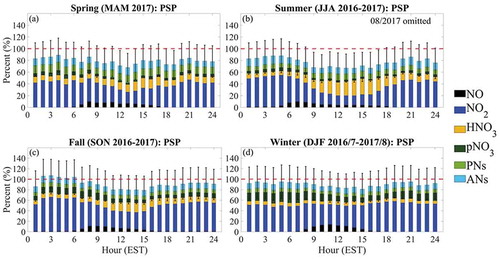
Figure 10. The diurnal variation of the hourly median NOy partitioning at QC during selected seasons. The dashed red line denotes 100% closure of the NOy budget, and the combined uncertainty of the measurements is given by the black error bars