Figures & data
Table 1. Comparison of biofilter performance reported in some studies on NH3 and volatile organic compounds (VOCs) removal
Table 2. Initial characteristics of composting materials
Figure 1. Schematic of the composting and biofiltration system. (1) Fermentation tank; (2) air distribution pipe; (3) blower; (4) odor collection pipe; (5) deodorization fan; (6) valve, (7) mass flow meter; (8) flow meter; (9) biofilters; gas sampling point (10) from composting, (11) after biofiltration, and (12) in the air; (13) temperature loggers; (14) multichannel sampler; (15) vacuum pump; and (16) gas monitor
Table 3. Experimental arrangement of biofilters
Table 4. Initial and final characteristics of biofilter media
Figure 2. Temperature of composting piles (arrow means turning)
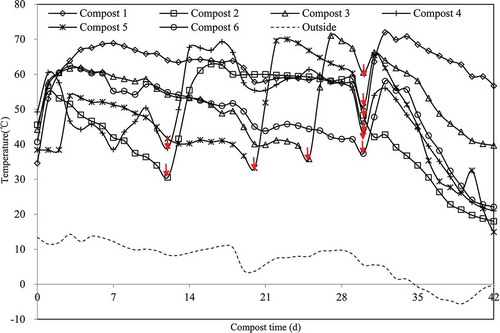
Table 5. Gas compound concentrations of volatile organic compounds during dead pigs and manure composting
Figure 3. NH3 concentration inlet and outlet gas of biofilter and average RE of treatments with different content times
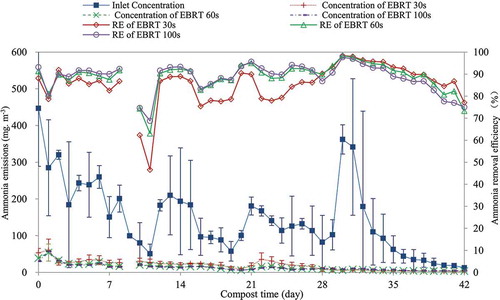
Figure 4. TVOCs inlet and outlet gas of biofilter and average RE for treatments with different content times of (a) DMS, (b) DMDS, (c) DMTS, and (d) TMA
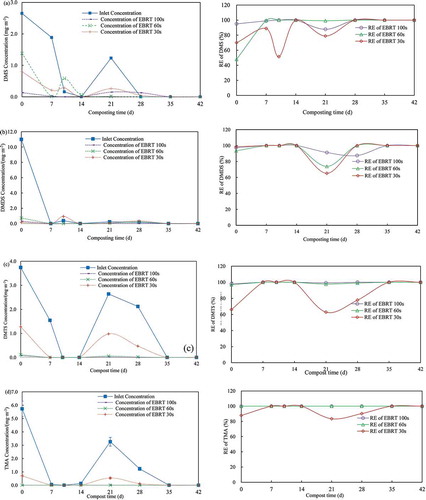
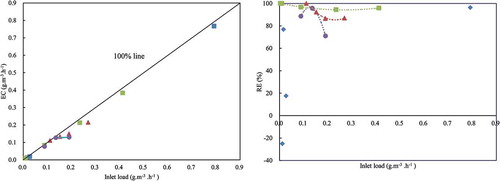
Figure 5. (a) Variations in removal efficiency and elimination capacity of NH3 with changes in inlet load and (b) influence of inlet concentration on RE and EC (The circle, EBRT 30s; triangle EBRT60s; cross, EBRT 90s)
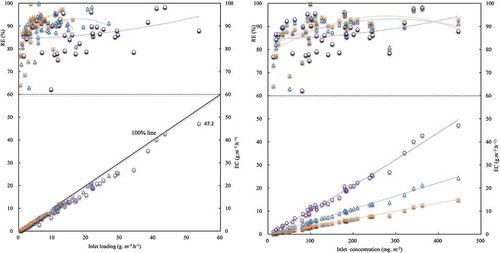
Table 6. The solubility of DMS, DMDS, DMTS, and TMA
Figure 6. (a) Elimination capacity and (b) removal efficiency of DMS, DMDS, DMTS, and TMA versus inlet load