Figures & data
Table 1. Particle size distributions of the soil
Table 2. Physical and chemical properties of MPA
Figure 1. Formation process of anti-dissolution film after MPA exposed in air
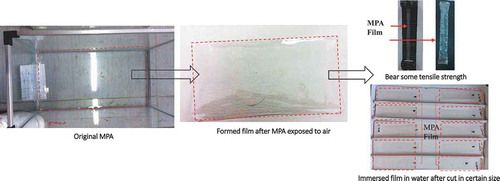
Figure 2. Scanning Electron Microscope (SEM) of MPA treated soil
Figure 3. Wind erosion test
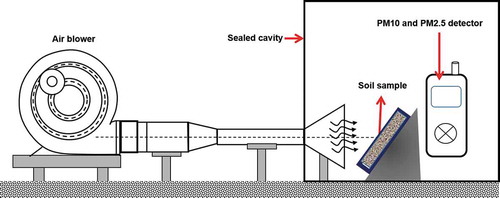
Figure 4. Rain erosion test
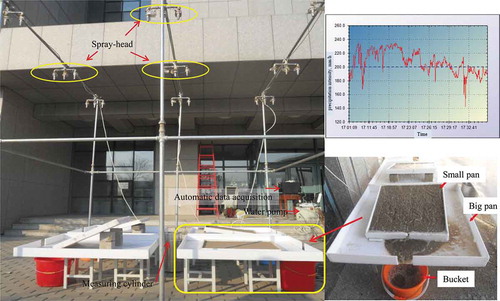
Table 3. Parameters of influencing factors
Figure 5. Surface morphologies distribution of soil treated with water and different spraying amount of MPA
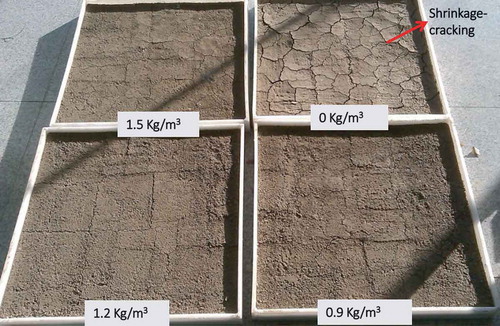
Figure 6. Erosion weight and products as a function of MPA spray amount variability with rain erosion setup shown in
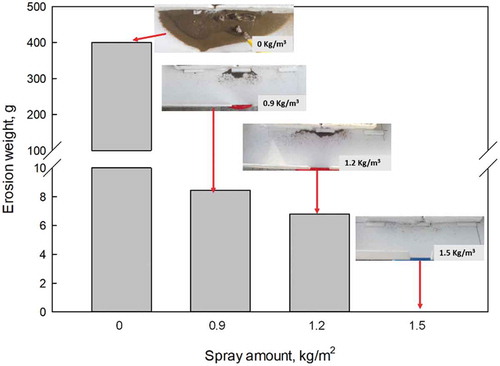
Figure 7. Surface failure as the function of rain erosion with setup shown in , and treatment variability (a) with water only; (b) with MPA of 0.9 kg/m2; (c) with MPA of 1.2 kg/m2; and (d) with MPA of 1.5 kg/m2
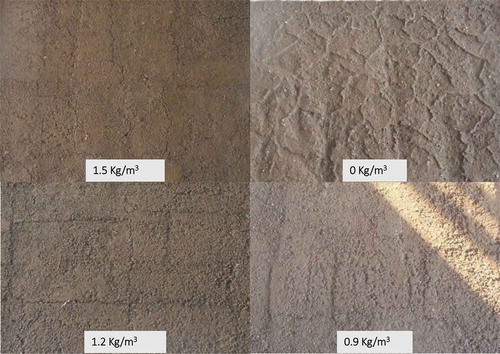
Figure 8. Soil erosion particles distribution as the function of rain erosion with setup shown in , and treatment variability (a) with water only and (b) with MPA of 0.9 kg/m2
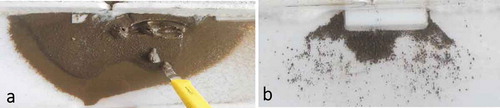
Figure 9. Distribution of PM10 and PM2.5 as a function of wind erosion time with setup shown in , and MPA spraying amounts variability
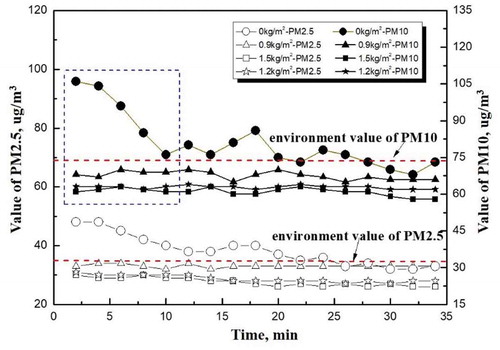
Figure 10. Erosion weights and failures as the function of soil type variability with rain erosion setup shown in
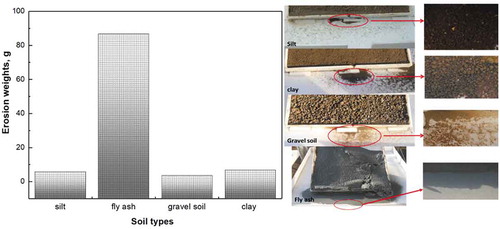
Figure 11. ΔPM10 and ΔPM2.5 (see EquationEqs. 3(3)
(3) and Equation4
(4)
(4) ) as a function of wind erosion time with setup shown in , and soil type variability
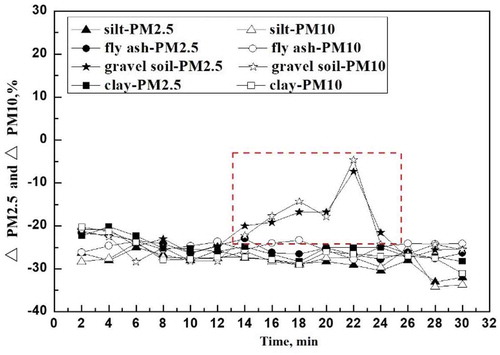
Figure 12. Erosion weights and PM10 and PM2.5 distribution as a function of soil slopes variability with rain and wind erosion setup shown in and , respectively
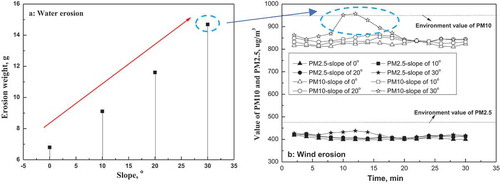
Figure 13. Erosion weights and failures as a function of soil slope morphology variability with rain erosion setup shown in
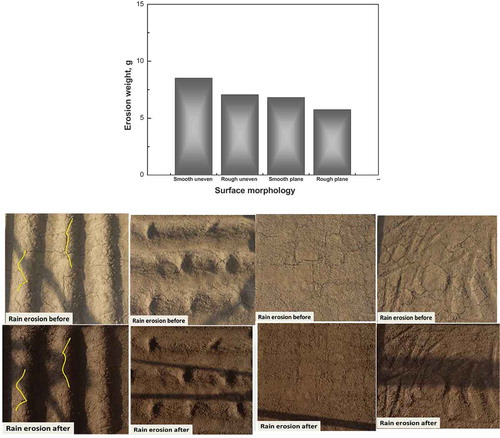
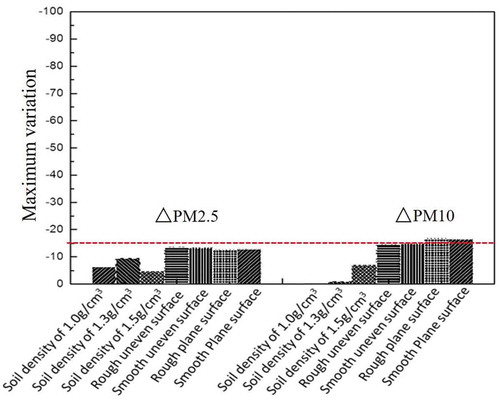
Figure 14. ΔPM10 and ΔPM2.5 (see EquationEqs. 3(3)
(3) and Equation4
(4)
(4) ) as a function of soil slope morphologies and density with wind erosion setup shown in Figure 3