Figures & data
Figure 1. (Left) The Terrace–Kitimat valley (TKV) in the Coast Mountains of northwestern British Columbia, Canada. PM2.5 monitoring stations are indicated with red markers, with an aluminum smelter (factory icon) located just south of the Haul Road Station. The red line is a transect denoting valley centerline used in this study. (Right) land cover types over the TKV: 1. Temperate needleleaf forest, 2. Temperate broadleaf deciduous forest, 3. Mixed forest, 4. Temperate shrubland, 5. Barren land, 6. Urban and built-up, 7. Water
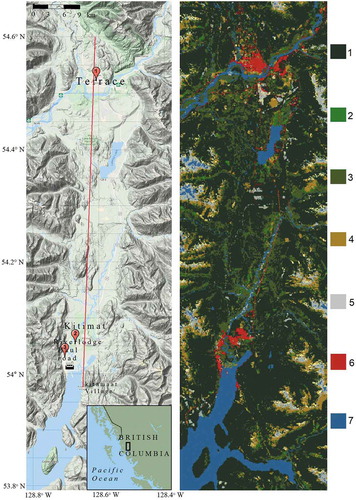
Table 1. PM2.5 monitoring locations, and hourly observation data completeness for the year 2017, to the nearest percentage (%)
Table 2. Pearson’s correlation coefficients (r) and coefficients of divergence (CoD), for daily average PM2.5 between station pairs in 2017
Figure 2. Seasonal distribution of PM2.5 in the TKV. Top: Pollution roses for summer (I) and winter seasons (II) at monitoring stations. Seasonal averages (in μg m−3) are in blue. Bottom: Average of hourly PM2.5 concentrations and their coefficients of variation (CoV). CoV is the standard deviation of hourly concentrations divided by the diurnal mean
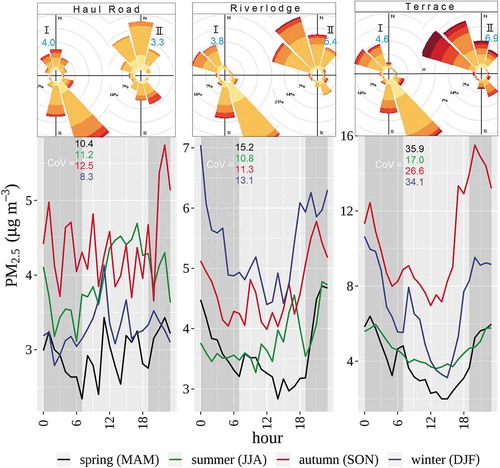
Figure 3. (a.) Regression plots of quantile mean concentrations of the original model output against those of observational data at Terrace, and derivation of bias-correction formulae. Small open circles are the data points for both (b.) Quantile plot for modeled and observed (OBS) data at pollutant monitoring stations. The concentration at each octile is the mean of all hourly concentration values within that octile. SIMPLE, POWER and DEG_2 are post-correction profiles
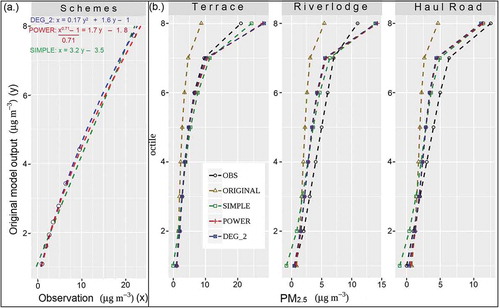
Table 3. Statistical measures for bias-correction evaluations. In the formulae, Mi is modeled/corrected concentration, with corresponding observation Oi, while (
) are their respective means. Overbar denotes computation of a mean value
Figure 4. Top: Tiered air management threshold values and actions for ambient PM2.5 adapted to British Columbia from (CCME Citation2012). Bottom: Conformity of original and corrected outputs to observed CCME 2012 PM2.5 management categories
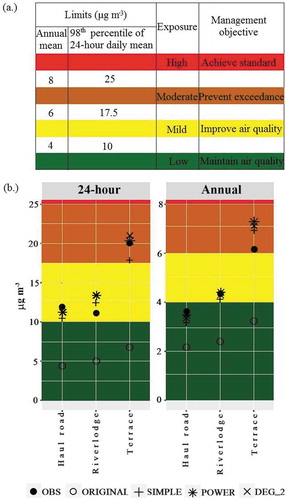
Table 4. Statistical evaluation of bias-corrections in comparison to original model output, per season. Comparisons are based on daily means
Table 5. CoD between stations as proxies of PM2.5 spatial variability for original and bias-corrected model outputs, per season
Table 6. Accuracy (NMB × 100%, see ) of original and corrected values for the 24 hr and annual PM2.5 metrics
Figure 5. Spatial plot of bias-corrected annual mean PM2.5 concentrations (a), and ratio of bias-corrected concentrations to those of the original model output (b) for (i) SIMPLE (ii) POWER and (iii) DEG_2
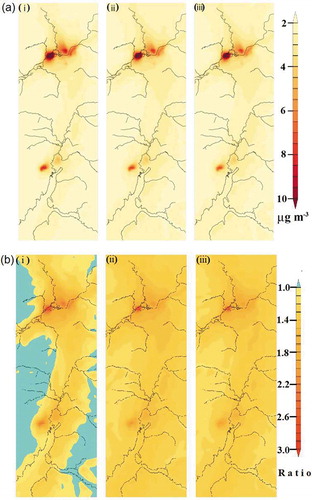
Figure 6. Centerline profile of bias-corrected annual mean concentrations
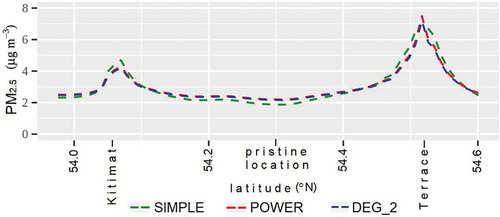
Table 7. Annual and seasonal background PM2.5 levels in the TKV with the various bias-correction formulas
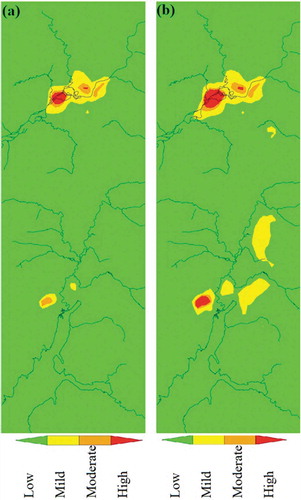
Figure 7. Color-coded classification of modeled PM2.5 ambient exposure risk from POWER scheme using thresholds in . (a) annual metric; (b) daily metric