Figures & data
Figure 1. Schematic diagram of the experimental apparatus: 1, wet ESPs shell; 2, DC power; 3, insulation; 4, rotameter; 5, water pump; 6, water tank; 7, water distribution pipe; 8, collecting electrode; 9, discharge electrode; 10, wind shield; 11, heater; 12, aerosol generator; 13, particles feed port; 14, induced draft; 15, regulating valve; 16, export sampling port; 17, inlet sampling port
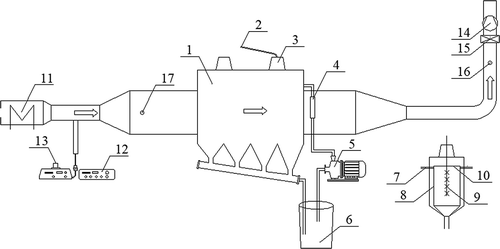
Figure 2. The discharge electrodes structure

Figure 3. The patterns of the holes and slots. (a) VS. (b) HS. (c) CH
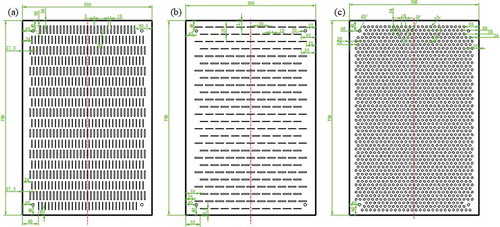
Figure 4. Characteristics of particles used in the experiments: (a) Number distribution of particles. (b) Particles morphology. (c) Particles Composition
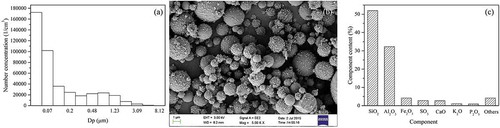
Figure 5. V–I characteristics.(Cin: 70 mg/m3;SCA: 20 m2/(m3/sec);F:60 L/hr;T: 20 °C;V: 0 ~ 70 kV)
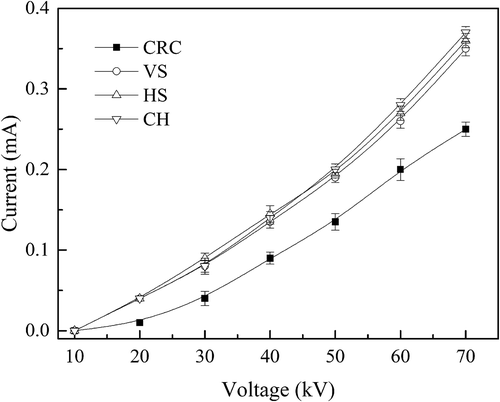
Figure 6. The relationship between collection efficiency and corona power. (Cin: 70 mg/m3;SCA: 20 m2/(m3/sec);F:60 L/hr;T: 20 °C;V: 0 ~ 70 kV)
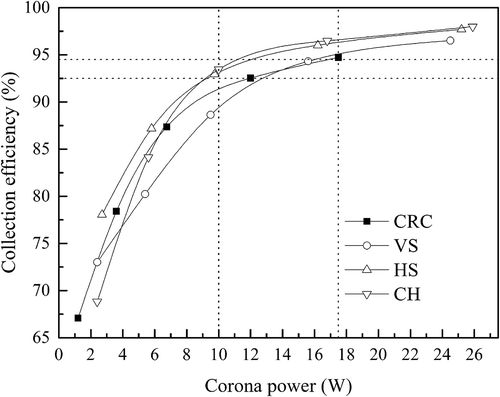
Figure 7. Effects of the water film on the collection efficiency. X1: Particles distribution using FRP collectors with dry and wet surfaces. X2: The collection efficiency of particles using the FRP collectors with wet surfaces coupling voltage. (X = a, b, c) (Cin: 70 mg/m3;SCA: 20 m2/(m3/sec);F:60 L/hr;T: 20 °C;V:60 kV)
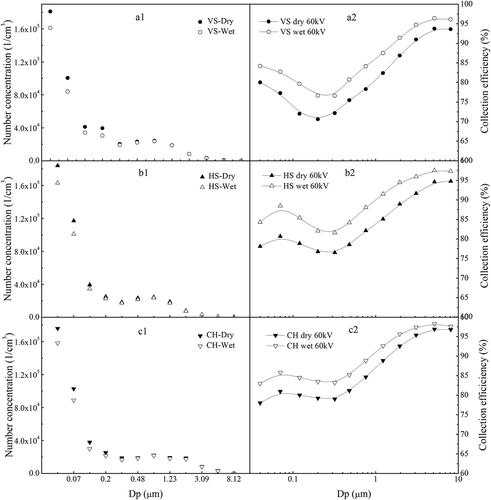
Figure 8. The contrasted collection efficiency of wet and dry surfaces
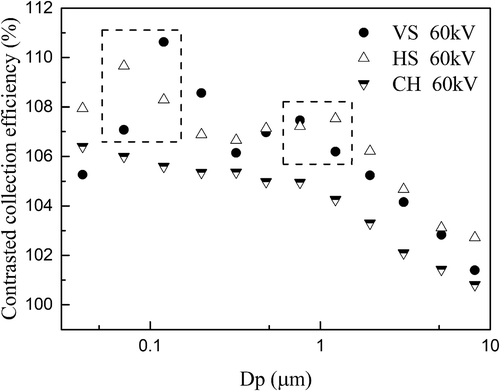
Figure 9. Effects of applied voltage on the removal of particles. (Cin: 70 mg/m3;SCA: 20 m2/(m3/s);F: 60 L/hr;T: 20 °C;V: 40, 60 kV)
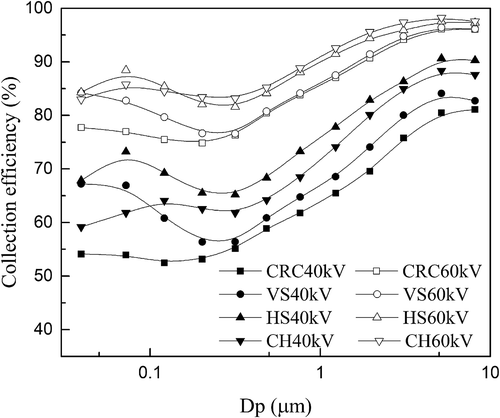
Figure 10. Effects of applied voltage on the RCE. (Cin: 70 mg/m3;SCA: 20 m2/(m3/s);F: 60 L/hr;T: 20 °C;V: 40, 60 kV)
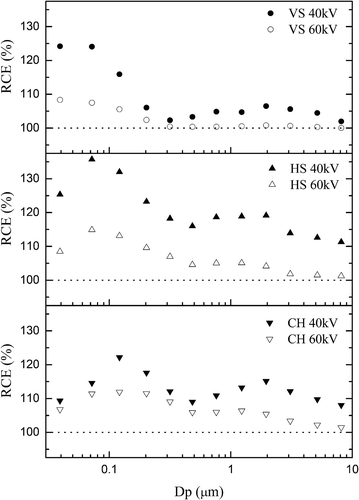
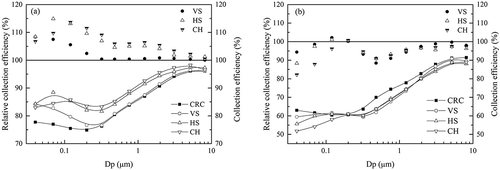
Figure 11. The effect of SCA on particles collection efficiency and RCE. (a) SCA:20 m2/(m3/s), (b) SCA:10 m2/(m3/s). (Cin: 70 mg/m3;F: 60 L/hr;T: 20 °C;V: 60 kV)