Figures & data
Table 1. The physical properties of the soil
Figure 1. Grain size distribution for clayey soil
Table 2. Results of EDS for sewage sludge ash
Figure 2. Results of EDS for sewage sludge ash (SSA)
Figure 3. Grain size distribution of the soil before and after adding with different percents of SSA
Figure 4. Effect of SSA on consistency limits with curing time of 3 days
Figure 5. Effect of SSA on consistency limits with curing time of 28 days
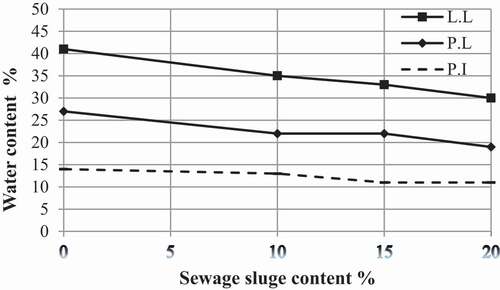
Figure 6. Relationship between specific gravity and SSA content
Figure 7. Relationship between moisture content (ω) and dry density (ρd) for clayey soil stabilized with different SSA contents
Figure 8. Relationship between SSA content and maximum dry density
Figure 9. Relationship between SSA content and the optimum moisture content
Figure 10. The relationship between SSA/and pH value of specimens at different curing ages
Figure 11. Relationship between strain and axial stress for the different SSA contents with curing time of 3 days
Figure 12. Relationship between strain and axial stress for the different SSA contents with curing time of 14 days
Figure 13. Relationship between strain and axial stress for the different SSA contents with curing time of 28 days
Figure 14. Relationship between SSA and unconfined compressive strength of samples at different curing ages
Figure 15. Relationship between the unconfined compressive strength for samples and the sewage sludge ash added to clayey soil at curing ages 3, 14 and 28 days
Figure 16. Clay specimens with a) 0%, (b) 10%, (c) 15%, (d) 20% of SSA and curing time 14 days after failure by unconfined compression test
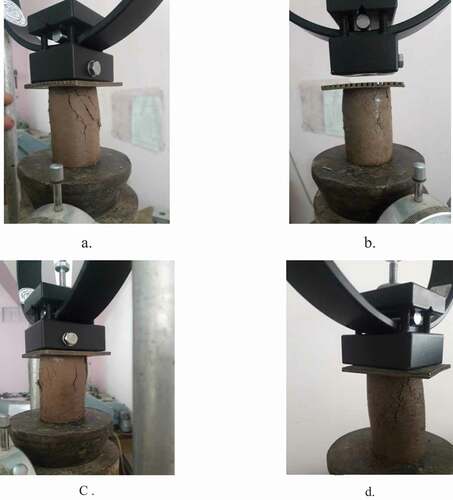
Figure 17. Clay specimens with a) 0%, (b) 10%, (c) 15%, (d) 20% of SSA and curing time 28 days after failure by unconfined compression test
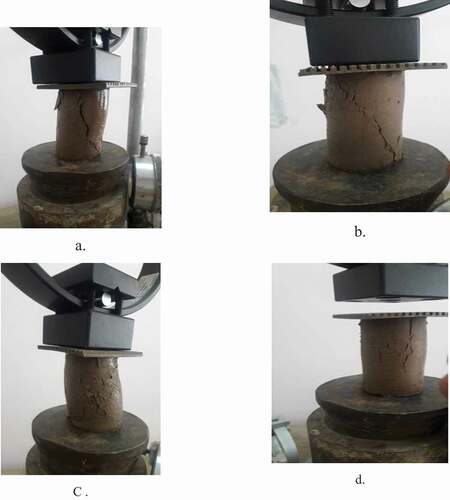
Figure 18. Variation of CBR with addition of different percentages of SSA and different curing time
Table 3. The physical properties of the soil treated with SSA
Table 4. The properties of the soil treated with SSA and curing time
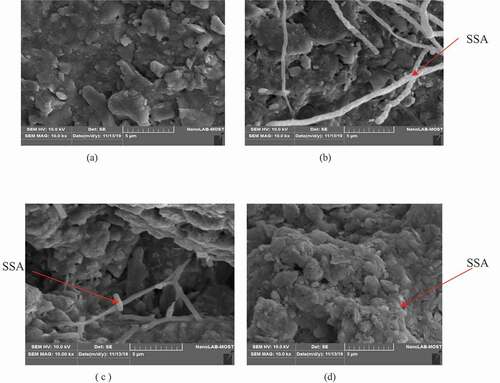
Figure 19. Results of SEM analysis for clayey soil paste specimens with curing time of 14 days and SSA content of (a) SSA = 0%, (b) SSA = 10%, (c) 15%, and (d) 20%