Figures & data
Figure 1. Schematic of the experimental setup for characterizing the performance of the string-based collectors
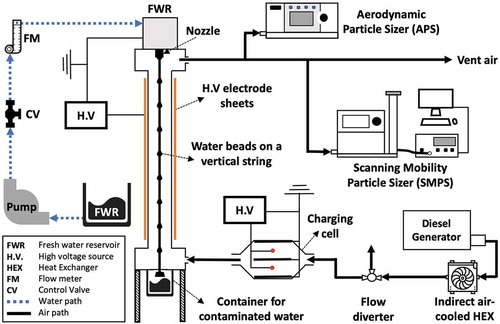
Figure 2. Schematics of (a) the rectangular and (b) the cylindrical configuration on the left and (c) the particle pre-charger and the front view of the particle pre-charger used in this study on the right
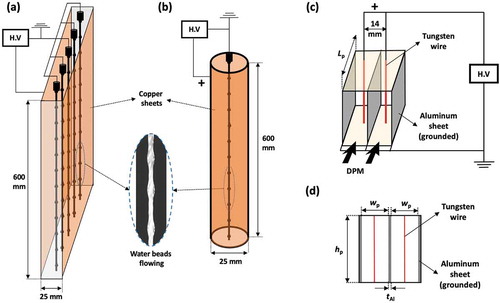
Table 1. Parameters and test conditions used to study the string-based WESP performance
Figure 3. Schematics of the numerical simulation domains for (a) the rectangular WESP and (b) the cylindrical WESP
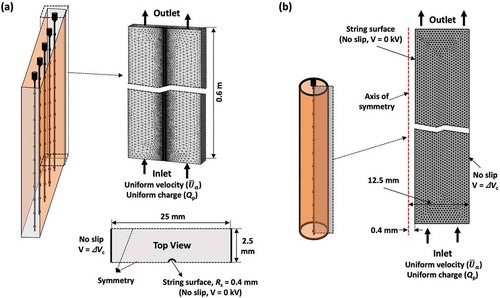
Figure 4. (a) Voltage-current curve and (b) average particle size distribution at the inlet of the particle pre-charger
Figure 5. Effect of the water flow rate per string on the fractional collection efficiency of the cylindrical WESP
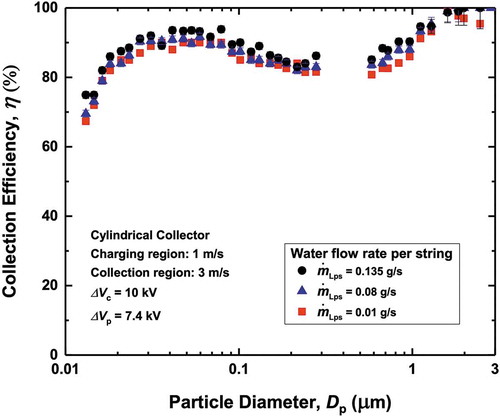
Figure 6. Collection efficiencies as a function of the liquid-to-gas flow rate ratio for different WESP devices. We compare our device with previously reported WESP devices; electrostatic droplet spray (Pilat Citation1975), cylindrical WESP for DPM (Saiyasitpanich et al. Citation2006), flat-plate WESP (Kim et al. Citation2011), electrospray tower scrubber (Kim et al. Citation2014), cross flow string-based WESP (Ali et al. Citation2016), wire-to-plate WESP (Yang et al. Citation2017), and self-flushing WESP (Su et al. Citation2018)
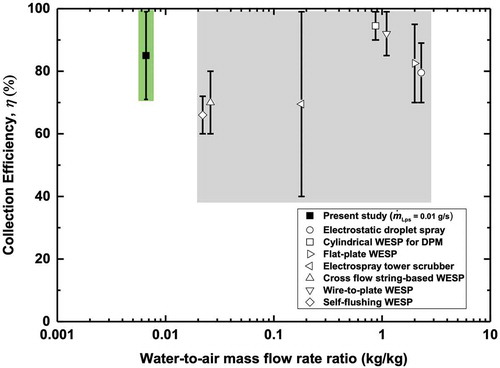
Table 2. Comparison of the experimental conditions and performance metrics of the present design with those of previous WESP designs
Figure 7. Experimentally measured and predicted (Cochet’s model) fractional collection efficiencies for the cylindrical and the rectangular WESP at different collector bias voltages. The experimental and predicted values are presented as the symbols and the lines, respectively
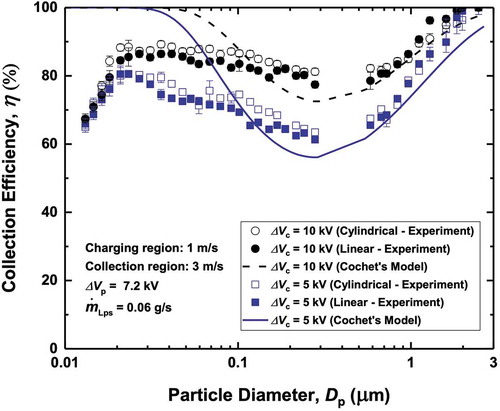
Figure 8. Effect of the gas velocities in the collector on the experimentally measured and predicted (Cochet’s model) fractional collection efficiencies for the cylindrical and the rectangular WESP. The experimental results and predicted values are presented as the symbols and the lines, respectively
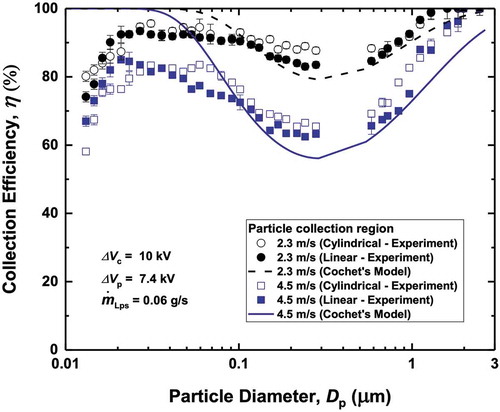
Figure 9. (a) Number of charges on particles obtained using our numerical simulation and using Cochet’s model as a function of the particle size. The numerical simulation and the Cochet’s model results are presented as the symbols and the dashed line, respectively, and (b) Numerically simulated particle trajectories in the cylindrical collector (domain size = 12.5 mm × 600 mm, inlet airflow velocity = 3 m/s, number of particles at inlet = 100, particle diameter, dp = .1 μm, average number of charges on the particle, Qp = 11.5, applied voltage = 10 kV)
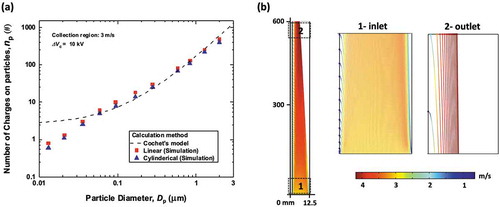
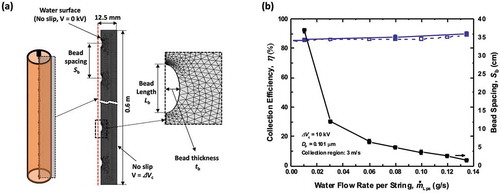
Figure 10. (a) Schematics of the numerical simulation domain for the cylindrical WESP with bead profiles along the string. (b) Effect of the water flow rate per string on the bead spacing (obtained from experiments) and the collection efficiency (obtained from experiments and numerical simulation for particles with 0.1 μm diameter). The experimental and numerical simulation results are presented as the solid and hollow symbols, respectively