
Figures & data
Figure 1. Bonding arrangement of OPTS (Nadhari et al. Citation2013)
Figure 2. A brief display of the extraction of OPTS
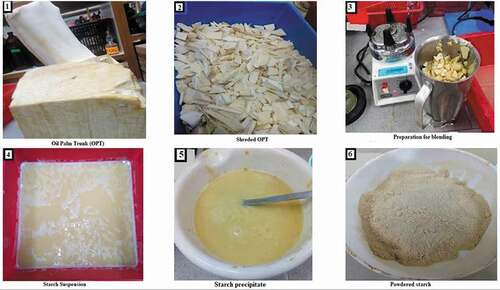
Table 1. Actual values with coded values in parenthesis for the experimental parameters
Table 2. Central composite design outcome for experimental parameters and response (actual and predicted)
Table 3. ANOVA outcome for modified quadratic model of response surface
Figure 3. DesignExpert originated plot (a) actual versus predicted; (b) normal probability plot of the residuals
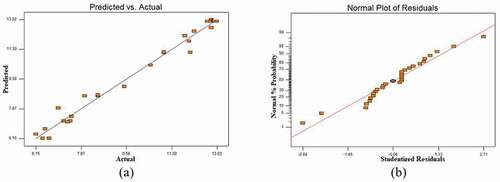
Figure 4. 3D response surface plot, (a) model graph from ANOVA; (b), (c), (d) numerical optimization based on interrelation of parameters
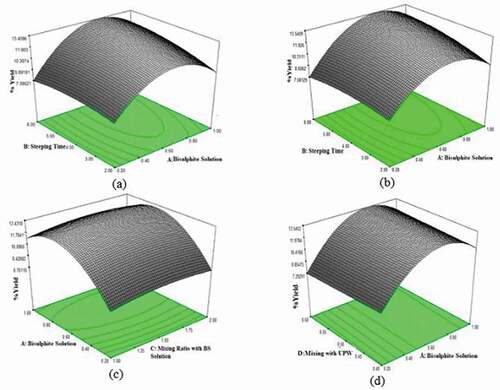
Figure 5. Numerical optimization for four parameters and one response with desirability function
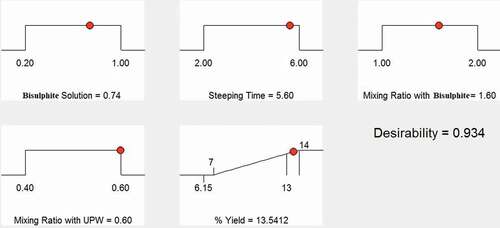
Table 4. Outcomes of verification study at optimum condition
Figure 6. (a) SEM micrograph of native starch at 4000 magnifications; (b) SEM micrograph of native starch at magnification of 6000s; (c) EDX analysis report for OPTS
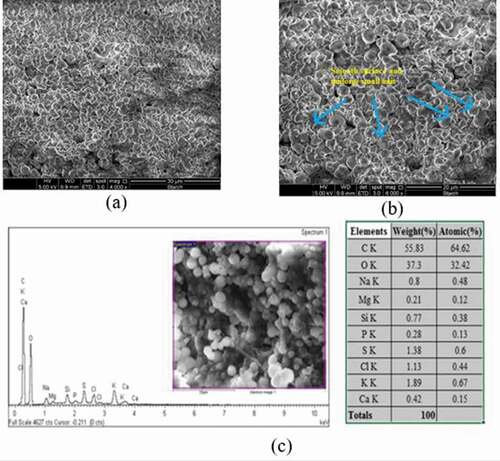
Figure 7. (a) XRD analytical shape of OPTS; (b) FTIR spectrum for extracted starch (OPTS)
Table 5. Solubility index (SI) and swelling power (SP) of extracted starch
Table 6. A typical costing outline for OPTS synthesis (based on 500 gm OPT processing)