Figures & data
Figure 1. Schematic diagram of the experimental apparatus: 1, wet ESPs shell; 2, insulation; 3, DC power; 4, rotameter; 5, water distribution pipe; 6, collecting electrodes; 7, discharge electrodes; 8, water tank; 9, circulating water; 10, circulating pump; 11, aerosol generator; 12, particles feed port; 13, heater; 14, induced draft; 15, regulating valve; 16, export sampling port; 17, inlet sampling port
Figure 2. The structure and appearance of electrodes: (a) the discharge electrodes; (b) the collecting electrodes
Figure 3. Characteristics of particles used in the experiments: (a) Number distribution of particles. (b) Particles morphology. (c) Particles Composition
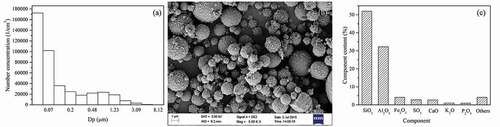
Figure 4. Performance comparison between the MCE and the CRC. (a) V–I characteristics, (b) The total dust removal efficiency. (Cin: 70 mg/m3; t: 4 s; T: 20 °C; F:20 L/h)
Figure 5. Influence of the water film on the classification removal efficiency of particles. (a) Particles distribution using the MCE with dry and wet surfaces, (b) The classification dust removal efficiency comparison of particles using the MCE and CRC. (Cin: 70 mg/m3; t: 4 s; T: 20 °C; V: 40kV; F:20 L/h)
Figure 6. Effects of flue temperature on the dust removal efficiency. (Cin: 65 mg/m3; t: 4 s; T: 20, 60°C; V: 40kV; F:20 L/h)
Figure 7. Effects of gas residence time on the classification removal efficiency. (Cin: 70 mg/m3, t: 2,4s; T: 20°C; V: 40 kV; F: 20 L/h)
Figure 8. Effects of applied voltage on the classification removal efficiency of particles. (Cin: 70 mg/m3; t: 4 s; T: 20°C; V: 30,40,44,60 kV; F:20 L/h)
Figure 9. Effects of applied voltage on the relative removal efficiency. (Cin: 70 mg/m3; t: 4 s; T: 20°C; V: 30,40,44,50 kV; F: 20 L/h)
Figure 10. Effects of particle inlet mass concentration on the removal efficiency. (Cin:37 ~ 167 mg/m3; t: 4 s; T: 20°C; V: 30 ~ 44, 60 kV; F: 20 L/h)
Figure 11. Effects of flushing water flowrate on the removal efficiency. (Cin: 70 mg/m3; t: 4 s; T: 20°C; V: 40 kV; F: 20 ~ 60 L/h)