
Figures & data
Figure 1. Locations of natural gas gate and control facilities surveyed in this study
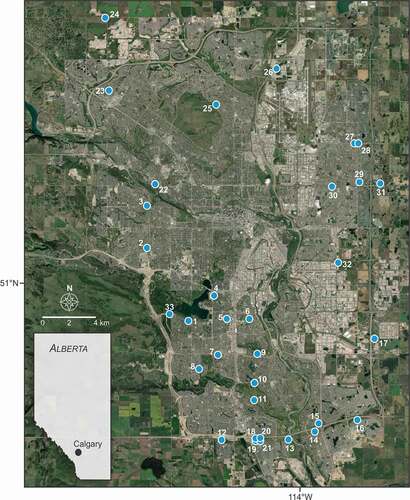
Figure 2. Examples of different fencing around facilities. (a) This facility had chain link fencing on the north side, and ~3 m tall solid walls around the east, west, and south sides (note residential area in background). (b) A solid wall ~3 m tall around a gate facility. (c) Chain link fencing with slats. (d) A mix of ~2 m tall chain link fencing with slats and wooden fencing (note residential area in background). The anemometer tower in the foreground of (b)-(d) is 1.65 m tall
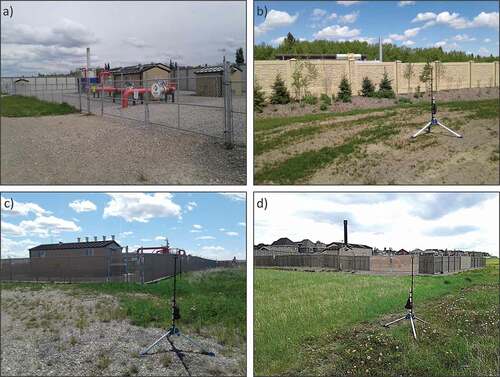
Figure 3. Illustration of survey methodology using a portable backpack trace gas analyzer, GPS, and stationary anemometer
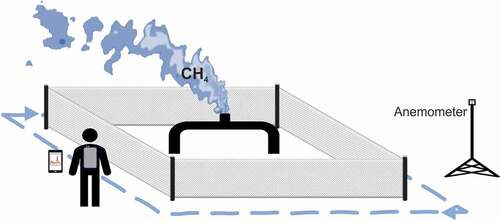
Table 1. Summary statistics for each facility. Wind metrics include the mean wind speed (), resultant wind direction (θR), and wind direction standard deviation (
) based on the Yamartino (Citation1984) method. The sample size of CH4 measurements from the walking surveys at each site is denoted by n. We supplemented missing wind metrics for select facilities with average hourly wind speed and direction from the Calgary International Airport automated weather station (World Meteorological Organization ID: 71877). Row shading corresponds to CH4 emissions plausibility: high (white), medium (light gray), low (gray)
Figure 4. Concentration maps of ΔCH4. Arrows denote resultant wind direction from on-site measurements or from the Calgary International Airport
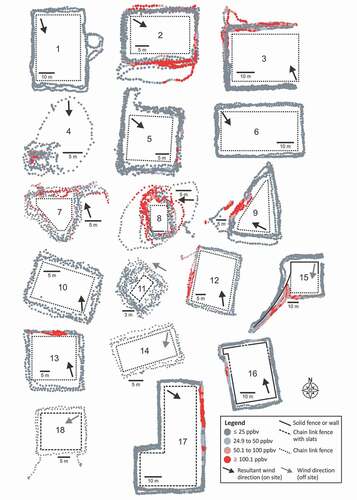
Figure 4b. (Continued)
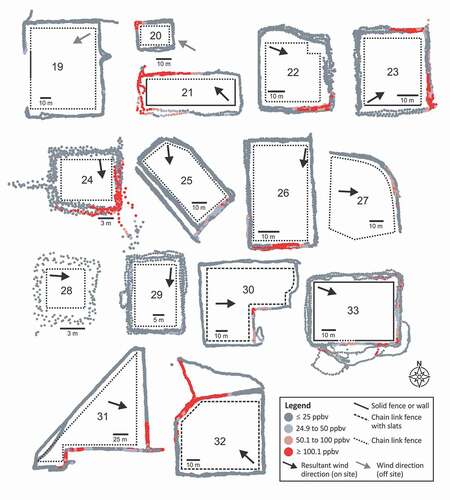
Figure 5. Facility rankings based on peak ΔCH4.
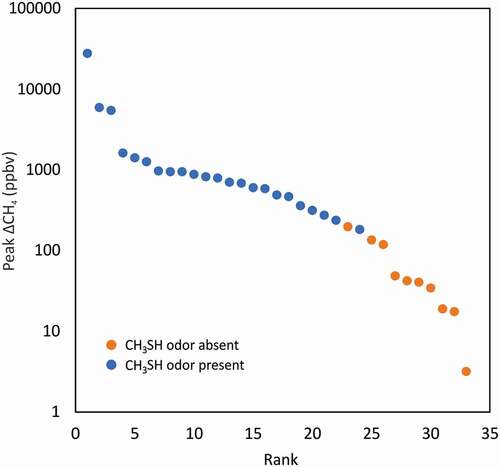
Table 2. OTM33A EQ summary of emissions rate estimates, mean wind speeds (), measurement distances, stability classes, and data quality indicator (DQI) scores. Reported stability classes are averages during survey times based on the standard deviation of the 2D wind direction and turbulent intensity. Stability classes range from 1–7 with higher numbers representing increasingly stable conditions