
Figures & data
Table 1. Parameters and values of automated filter tester and particle filtration
Figure 1. Schematic diagram of the TOPAS air filter test system.
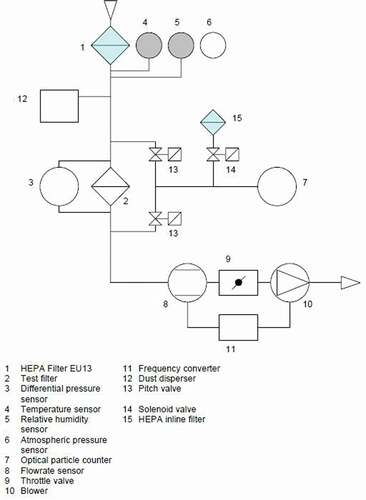
Figure 2. Layout of melt-blown filter assembly by class 11, 12, 13.
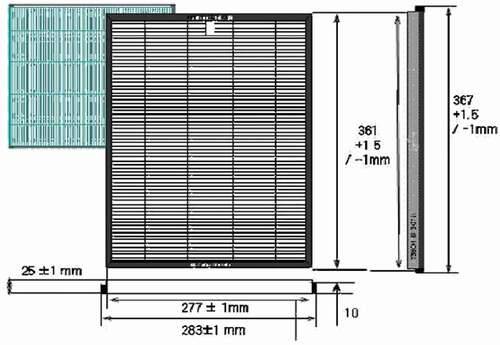
Figure 3. Fractional efficiency of melt-blown filters by particle size with 1 m/s face velocity through class E11, E12, and H13 filters.
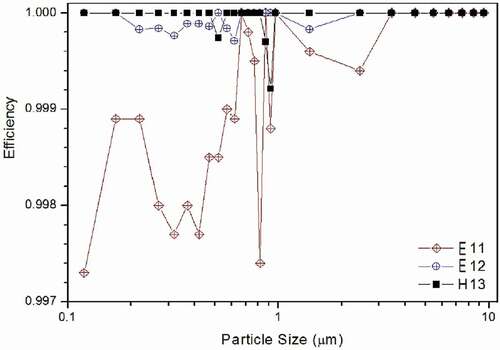
Figure 4. Fractional efficiency of melt-blown filters by particle size with 2 m/s face velocity through class E11, E12, and H13 filter.
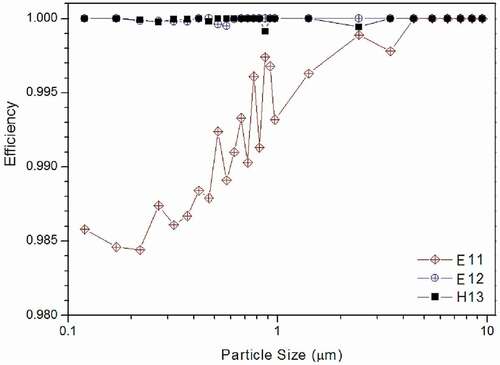
Figure 5. Fractional efficiency of melt-blown filter by particle size with 3 m/s face velocity through class E11, E12, and H13 filters.
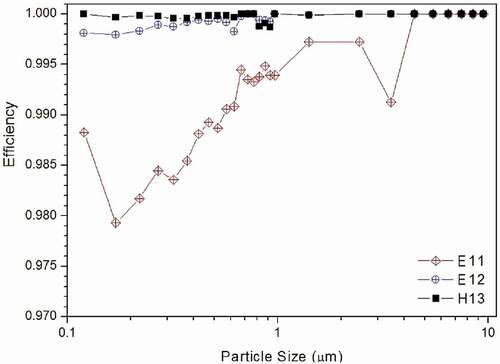
Figure 6. Variation of pressure in HEPA filter by dust loading amount at 1 m/s by classes (a), and H13 class by face velocity (b).
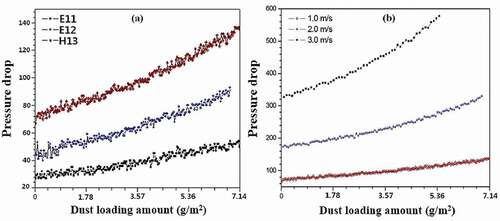
Figure 7. Morphological structures of melt-blown and glass-fiber media (H13) taken before and after dust loading using an electronic microscope.
Figure 8. Comparison of power consumption between melt-blown and glass-fiber media by increasing flow rate through class H13 filters (p < .05).
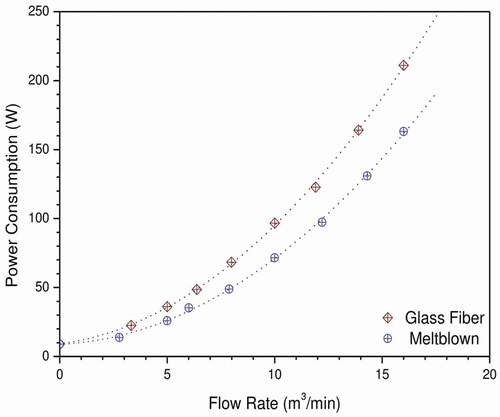
Table 2. Characteristics of filter media by class
Table 3. Comparison of efficiency by particle size, between melt-blown and glass-fiber filters in a negative air machine
Table 4. Application of melt-blown filter media in negative air machines to asbestos removal sites