Figures & data
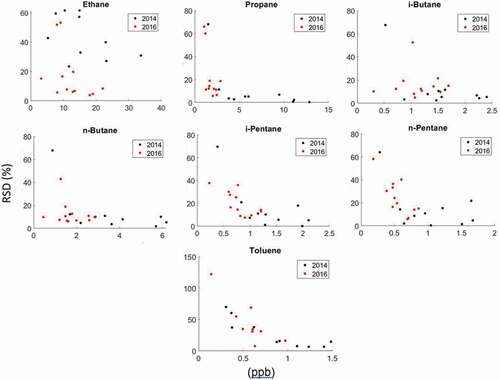
Figure 1. Schematic of adsorbent cartridges. (a) Adsorbent cartridge dimension shown with front opening on the left. (b) Schematic of internal components of a cartridge loaded with 540 mg of adsorbent. The glass fiber filter disk, adsorbent, glass fiber filter disk, gauze, and spring (overlapping circles) follow from left. (c) Identical to (b), but with half the mass of adsorbent (270 mg) and a larger spring. Regardless of the adsorbent bed mass, the distance from the front opening to the adsorbent bed was 1.5 cm. The distance from the end opening to the adsorbent bed varied based on the mass and packing of the adsorbent bed. (d) Relative volume of the cartridge occupied by 27, 54, 135, 270, and 540 mg of adsorbent.
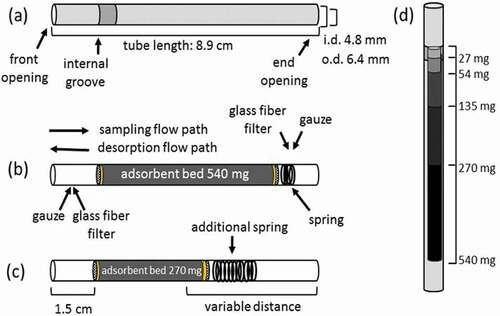
Table 1. Pearson correlation coefficients and p-values of cartridge and canister sampling during the summer and fall 2014 field campaigns. Canister and cartridge median relative standard deviations (RSDs), and median relative standard deviation ratios (RSDRs; cartridge/cans) from the Fall 2014 (n = 10) campaign are shown
Table 2. Adsorbent cartridge types tested. Multiple cartridges of each unique adsorbent type and mass were assembled
Figure 2. Blank chromatograms from cartridges loaded with (A) Carboxen 1000, (B) Carboxen 1016, (C) Tenax GR, and (D) a combination of Carboxen 1000 and 1016. Masses vary among adsorbents; 6.75 cm of each cartridge was occupied with adsorbent. The y-axis scale is identical for all panels.
Table 3. Comparison of Carboxen 1000, Carboxen 1016/1000 multi-stage adsorbent cartridges, and Tenax-GR cartridges. Analytical System Responses (ASRs) are the instrument response divided by the mixing ratio of the standard (ppbC) and the sample volume with relative standard deviations (RSD) for n = 5
Table 4. Linear regression results for analyte peak area (mV min) versus sampling time. Slope values represent analyte uptake rates. Other regression results are Pearson Correlation Coefficients (PCCs), and P-Values for collection of a standard mixture onto 1016/1000 and ‘1000/1016ʹ cartridges in a test atmosphere
Figure 3. Comparison of diffusive uptake on multi-stage cartridges for passive sampling of a standard gas mixture. Black data correspond to 1016/1000 cartridges (see 2.4.2). Red data are ’1000/1016ʹ cartridges. Note differences in y-axis ranges.
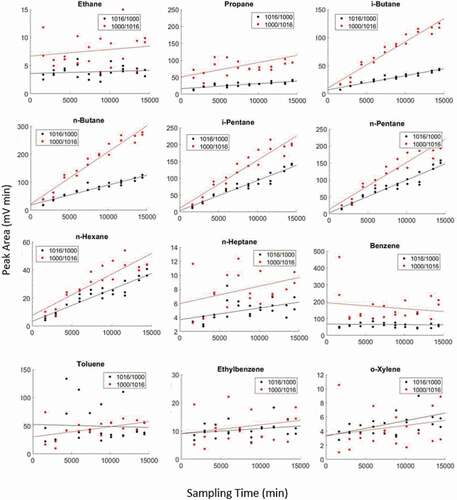
Table 5. Details of adsorbent conditioning experiments
Figure 4. Total BTEX mean peak area from three cartridges filled with Carboxen 1000 adsorbent conditioned under different flow rates, temperature, and duration. Symbol shape indicates conditioning time, symbol color indicates nitrogen flow through the cartridge during conditioning, and region of the graph indicates conditioning temperature.
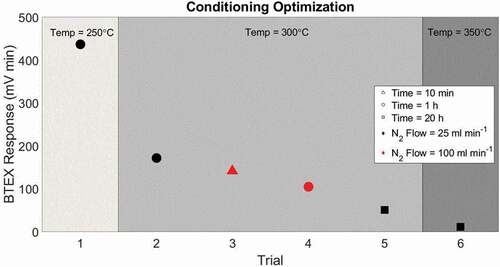
Figure 5. Sampling performance of cartridges with increasing masses of Carboxen 1000. Data are mean values of three determinations. All cartridges were actively loaded by pulling the same volume of a multi-component VOC standard through the adsorbent bed. Peak areas were normalized by the analyte mixing ratio in the standard (ppb) and the analyte effective carbon number (ECN; [Scanion and Willis Citation1985]).
![Figure 5. Sampling performance of cartridges with increasing masses of Carboxen 1000. Data are mean values of three determinations. All cartridges were actively loaded by pulling the same volume of a multi-component VOC standard through the adsorbent bed. Peak areas were normalized by the analyte mixing ratio in the standard (ppb) and the analyte effective carbon number (ECN; [Scanion and Willis Citation1985]).](/cms/asset/3f646217-3acb-4969-9530-2b8ccdb42ba9/uawm_a_2000518_f0005_oc.jpg)
Figure 6. Mass of analytes collected from a dry test atmosphere for ethane through n-hexane (1st and 2nd column) and benzene through o-xylene (3rd and 4th column). The 1st and 3rd columns show the results from the dry test atmosphere (Dry Bag), and the 2nd and 4th column the results from the humidified test atmosphere (Wet Bag). Results are from sampling on cartridges with increasing amounts of Carboxen 1000 adsorbent over 7 days. Multiple cartridges of each adsorbent bed mass were placed in the bag at the beginning of the experiment. One cartridge of each adsorbent bed mass was removed after 0.5, 1, 3, 5, and 7 days.
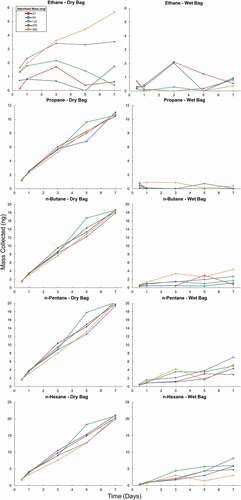
Figure 6. (Continued).
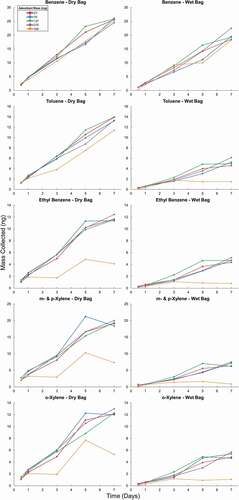
Table 6. Summary of H2O loading experiment. A 200 mL min−1 stream of zero air humidified to different RH % was sampled over three different adsorbent bed masses until the weight gain leveled off. The volume of humidified air and the saturation mass of H2O loaded are shown for each adsorbent bed mass and RH %
Table 7. Median uptake rates (n = 30) of cartridges loaded with 27, 54, 135, 270, and 540 mg of Carboxen 1000 adsorbent in dry and humidified simulated environments over the course of 0.5–7 days. Relative Standard Deviation results were calculated from the differentials of the day-to-day data
Table 8. Comparison of passive sampling uptake rates (in units of mL min−1) for BTEX compounds reported in the literature and results from this study. An “x” in the diffusion cap (Diff. cap) column indicates studies that used a diffusion cap
Table 9. Linear regression results for paired canister and cartridge sampling with Pearson correlation coefficients and p-values for the 2016 campaign. Canister and cartridge median relative standard deviations (RSDs), and median of the ratio of the RSDs of both methods (relative standard deviation ratios (RSDRs: cartridge RSD/canister RSD))
Figure 7. Pearson Correlation of canister and cartridge data during the 2014 BCPH field campaign (Carboxen 1016/1000), the winter 2014 comparison study (Carboxen 1016/1000), and the 2016 comparison study (27 mg of Carboxen 1000). Data for some compounds are not available for each campaign. P-Values and RSDRs are available in and .
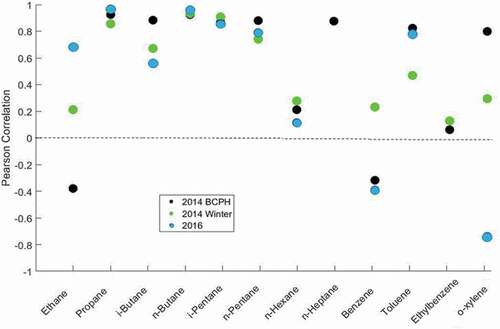
Figure 8. RSD of paired passive VOC sampling on adsorbent cartridges versus the ambient mixing ratio (from the canister sampling) during the 2014 and 2016 field deployments. Please note the different sampling strategies deployed during the two campaigns (see text).