Figures & data
Table 1. Air pollutant emission standards of the petrochemical industry worldwide. (unit: mg/m3)
Table 2. Basic information of each chimney of Enterprise A
Figure 1. Distribution of chimneys, and meteorological and monitoring stations
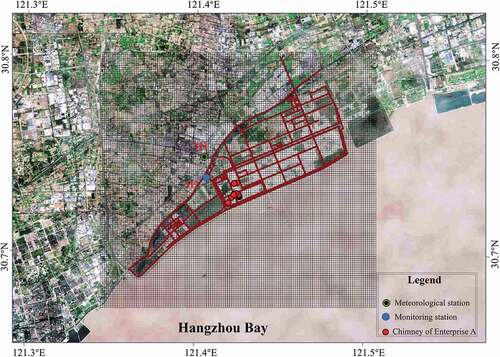
Figure 2. Wind roses in January, April, July, and October in Shanghai Chemical Industry Park (SCIP) in 2019
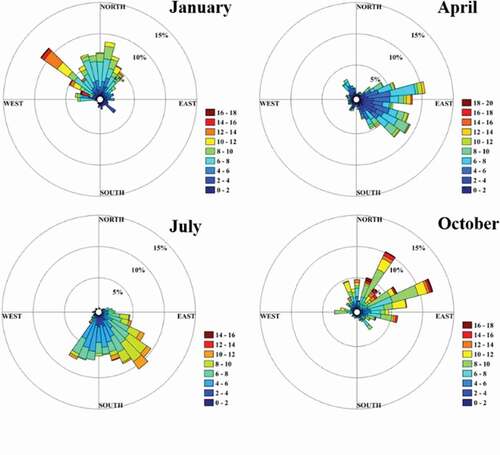
Table 3. Zero-impact concentration limits of each pollutant and 10% concentration of conventional pollutants as short-term average time
Table 4. Performance statistics for meteorological predictions
Figure 3. Time series of the measured and California Meteorological Model (CALMET) simulation results for the wind speed (m/s) and direction (°) at M1 station
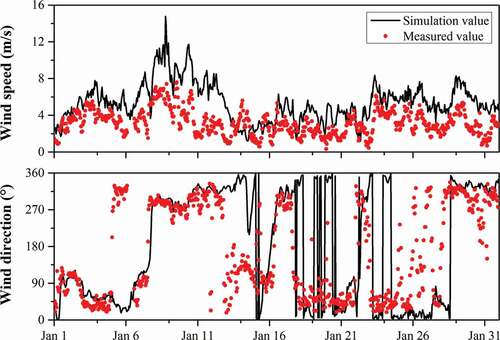
Figure 4. Time series of (a) wind direction (the blue shadow represents the downwind direction of emission sources for M2 station (wind direction is about 100°~140°)), the measured and simulation results of the NOx concentrations (?g/m^3) and (b) the correlation between the simulation and measured concentrations at M2 station
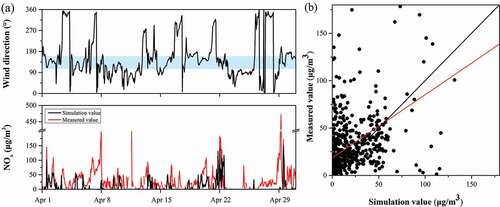
Figure 5. Spatial distribution of annual average concentration of pollutants. The concentration is the average of the annual simulation results; the red contour line is the scope of the chemical industry park, and the black contour line covers the area that exceeds the zero-impact limits
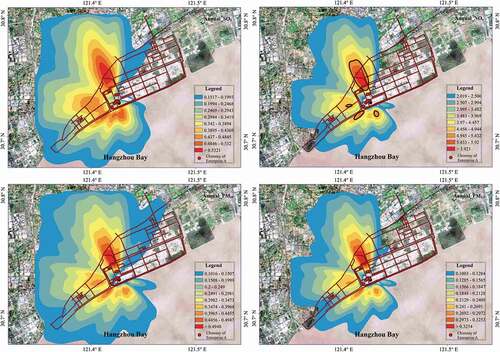
Figure 6. Spatial distribution of the 1-hour average concentration of volatile organic compounds (VOCs). The concentration is the maximum 1-hour ground level concentrations of VOCs (benzene) on each grid in the annual simulation results
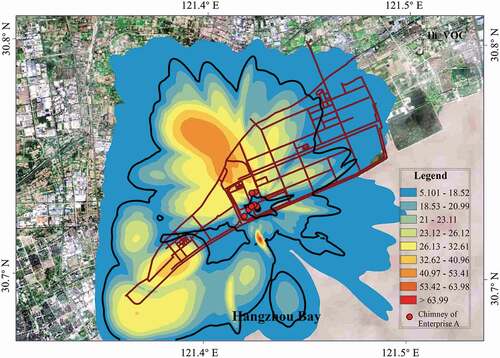
Figure 7. Spatial distribution of 1-hour average concentration of VOCs (benzene) during four seasons (shown in the order of winter, spring, summer, autumn; the concentration refers to the maximum 1-hour ground level concentrations of pollutants on each grid in the annual simulation results)
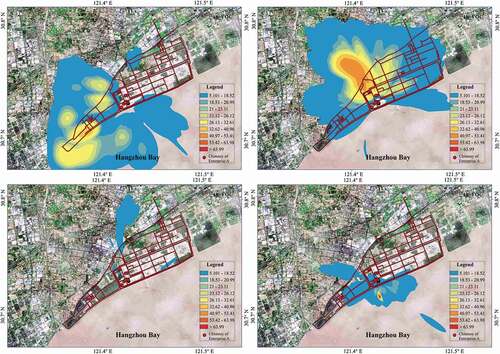
Figure 8. Spatial distribution of 24-hour average concentration of pollutants. The concentration refers to the maximum 24-hour average concentration of pollutants on each grid in the annual simulation results, and the black contour line covers the area that exceeds the 10% concentration
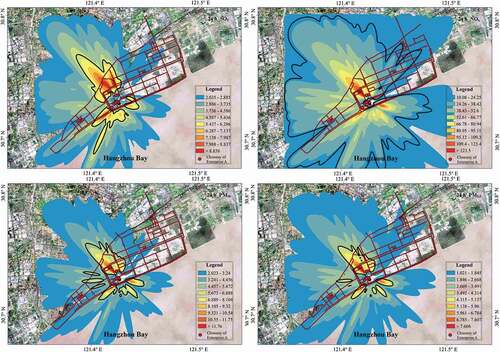
Figure 9. Spatial distribution of 24-hour average concentration of SO2 during four seasons
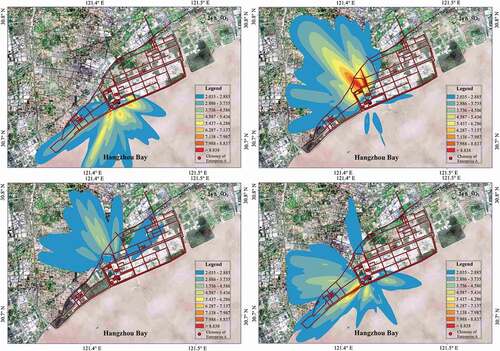
Figure 10. Spatial distribution of 1-hour average concentration of pollutants
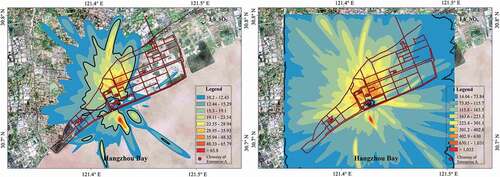
Table 5. Zero-impact emission limits. (unit: mg/m3)
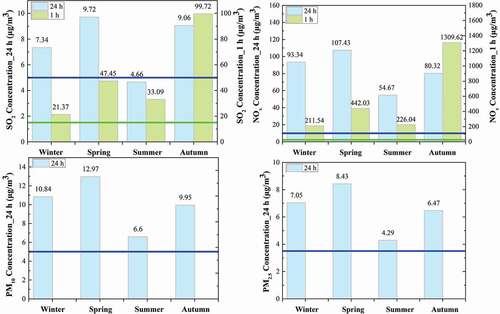
Figure 11. Comparison of the short-term pollutant concentration with the corresponding 10% of the Level I standard in Enterprise A. The blue and green lines refer to 10% of the Level I standard of 24-hour and 1-h average concentration, respectively