
Figures & data
Table 1. Selected properties of HPA, ACF and GAC (Jia, Yao, and Ma Citation2017)
Figure 1. Adsorption equilibrium and kinetics schematic diagram of water vapor (a) high purity nitrogen, (b) mass flow meter, (c) thermostatic water bath, (d) bubble bottle, (e) buffer bottle, (f) thermal gravimetric analyzer, (g) bypass (h) offgas.
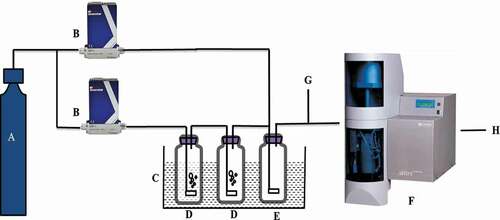
Figure 2. Adsorption-desorption isotherms (a,b,c) of water vapor on HPA, ACF and GAC at four temperatures and the zoomed-in view at 318 K and 328 K(d,e,f).
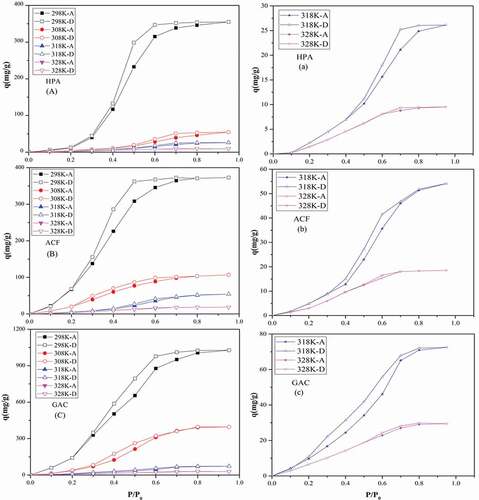
Table 2. CIMF fitting results of water vapor adsorption on HPA, ACF and GAC
Figure 3. Relationship between the adsorption capacity of water vapor on acidic groups with (a) the concentration of total acidic groups and (b) acidic groups except for –COOR.
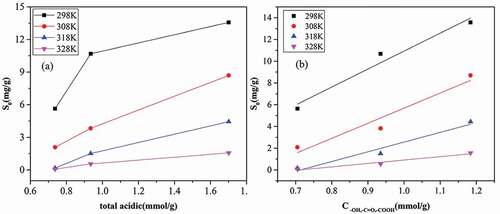
Figure 4. Relationship between the adsorption capacity of water vapor on micropores and the microporous volume of adsorbents.
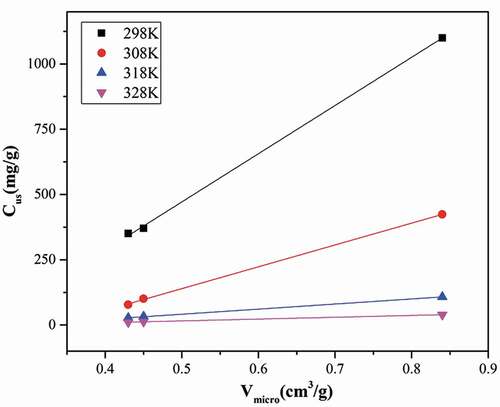
Figure 5. Variation of S0 and Cμs with temperature for water vapor adsorption on HPA, ACF and GAC at four temperatures (298, 308, 318, and 328 K).

Figure 6. Adsorption and desorption isotherms of water vapor on micropore and functional groups respectively at 298K (A: HPA-a/b, B:HPA-a, C: ACF-a/b, D:ACF-a, E: GAC-a/b, F:GAC-a; a: functional groups, b: micropores).
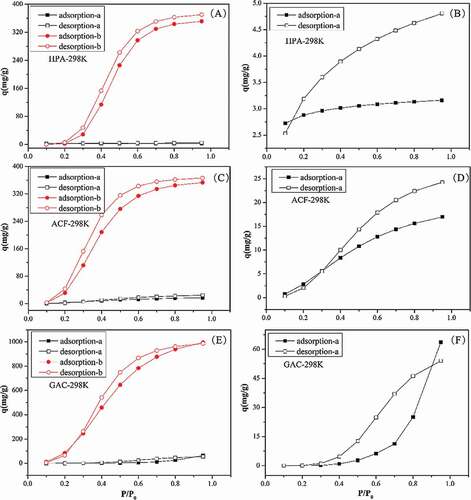
Figure 7. Effect of total (a)acidic groups concentration and (b) microporous volume on hysteresis loop size.
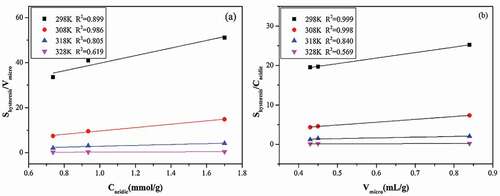
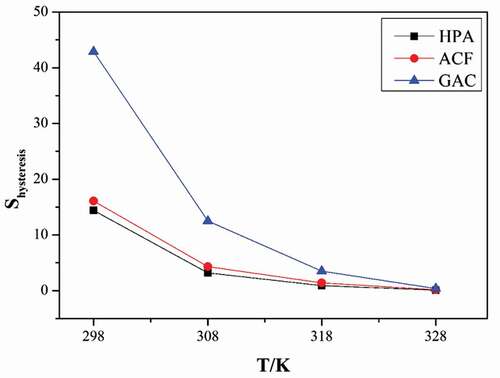
Figure 8. Hysteresis loop size of water vapor on three adsorbents at different temperatures.
Supporting_Information.docx
Download MS Word (2.1 MB)Data availability statement
The data supporting the findings of this study are available within the paper and its supporting information.