
Figures & data
Table 1. Water quality comparison between actual and simulated wastewater.
Figure 1. SEM images of the BFD at (A) 200x, (B) 400x, and (C) 10,000x magnification and corresponding spectra obtained by EDS.
Figure 2. X-ray diffraction pattern and XRF analysis of the BFD elements.
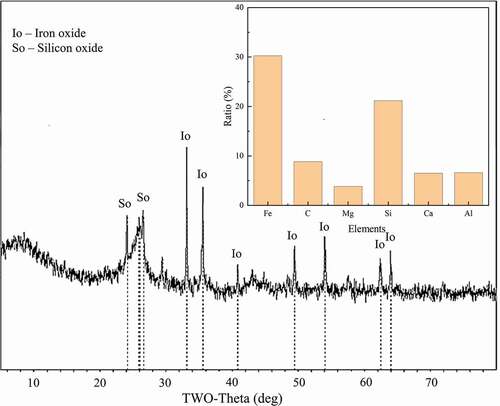
Figure 3. (a) The effect of adding different strong hydrophobic carbons (A: ZHF-R90, B: GWF-R90, and C: MWF-R90) on the CODcr and oil removal efficiency, and water contact angle of the MBFD1; Effect of the carbon content of the MBFD2(b), hydrophobic carbon (GWF-R90) dosage (c), and n(Fe)/n(Si) of the MBFD3 (d) on CODcr and oil removal efficiency; (b1) Comparison between the use of MBFD2 (ω(c):14.86%) and hydrophobic carbon (GWF-R90) on CODcr and oil removal efficiency; (e) Demulsification of the MBFD before and after modification; (Experimental conditions for (b1) and (c): hydrophobic carbon (GWF-R90) and MBFD2 (ω(c):14.86%): 0.8g·L−1, pH:5, the stirring pattern 2)
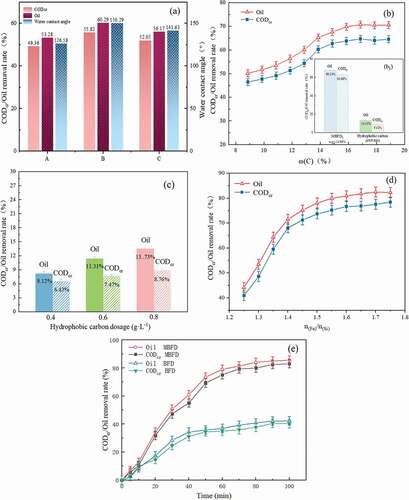
Table 2. XRF analysis results of elements of the BFD before and after modified.
Figure 4. SEM images for the MBFD (a) 400x, (b) 10,000x; SEM images of the MBFD1(c)1000x, the MBFD2(d)1000x and the MBFD3(e)10000x under the optimum modification condition.
Figure 5. Fourier infrared absorption spectra of the BFD before(a) and after(b) modified; (c) MBFD after one cycle.
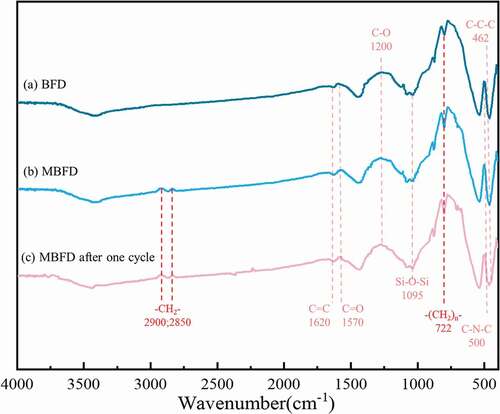
Table 3. Water contact angle, Zeta potential (pH:5) and Specific surface area results of the BFD before and after modified.
Figure 6. Effect of the initial pH(a), the BFD dosage(b), and the G– (c) on CODcr and oil removal efficiency of the modified BFD; (d) Effect of the modified BFD dosage on Zeta potential. (e) The pHzpc of these three BFDs (MBFD, MBFD2, BFD).
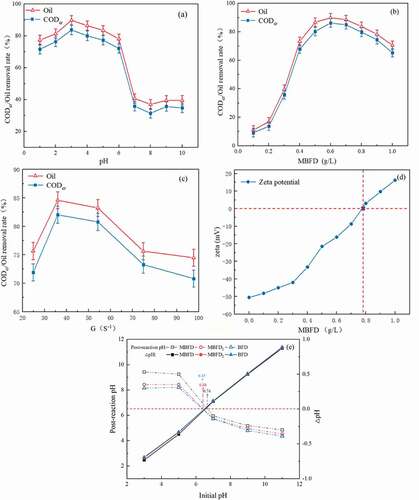
Figure 7. Mechanism of the MBFD demulsification.
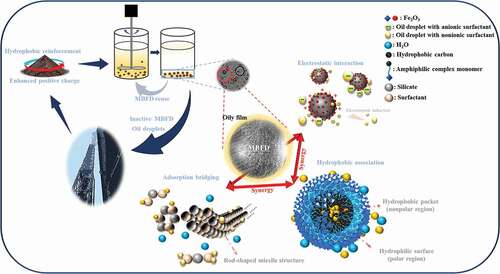
Table 4. Three-stage kinetic fit results.
Table 5. CODcr removal efficiency of modified the BFD different dosage.
Table 6. Water quality comparison of five batches of wastewater; Experimental condition: MBFD: 1.2 g·L−1, pH: 5, G–:36 S−1.
Supplementary_file.docx
Download MS Word (1.4 MB)Data availability statement
Data available from the corresponding author on request.