Figures & data
Table 1. Data composition.
Table 2. Model evaluation indexes (Bruce and Bruce Citation2018).
Table 3. Results of model evaluation.
Table 4. Comparisons of evaluation indexes before and after parameter adjustment (testing set validation, Model 3).
Figure 1. Model calculation importance.
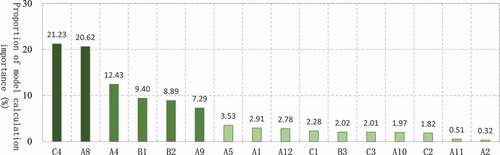
Figure 2. Changes in the evaluation results after removing single feature.
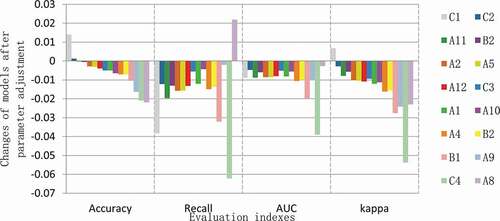
Figure 3. Feature SHAP value for a single sample.
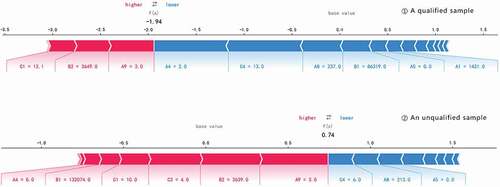
Table 5. Proportion of the feature SHAP values.
Figure 4. SHAP summary plot [(1)] and feature ranking plot [(2)].
![Figure 4. SHAP summary plot [(1)] and feature ranking plot [(2)].](/cms/asset/763c2f1a-af4a-4594-8ac4-de82b6c84d91/uawm_a_2035851_f0004_oc.jpg)
Figure 5. SHAP dependency graph (category features).
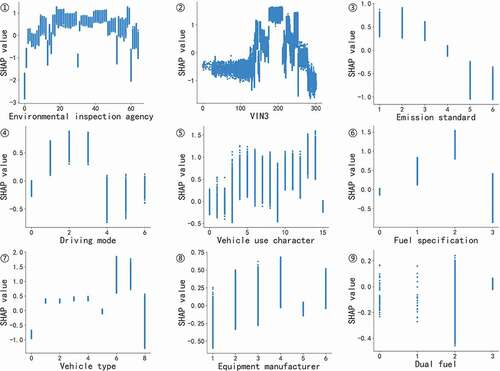
Figure 6. SHAP dependency graph (numerical features).
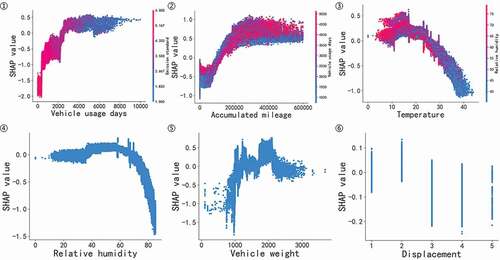
Figure 7. Differences in test pass rates among emission inspection agencies.