Figures & data
Figure 1. Method 5G dilution tunnel schematic (US Environmental Protection Agency Citation2000).
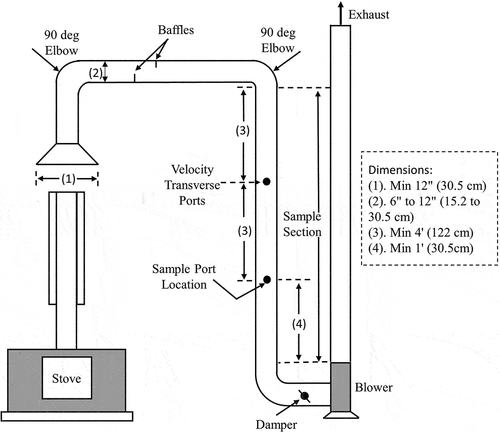
Figure 2. Lab-1 dilution tunnel configuration and computational grids.
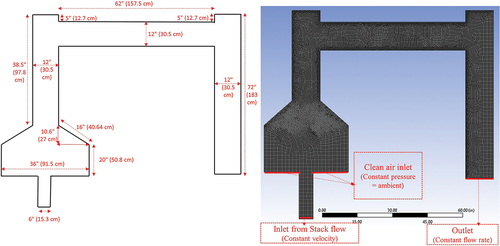
Figure 3. Lab-1 Velocity magnitude contours (left) and the temperature contours (right) for stack inlet velocity and temperature of V=1.5 m/s and T=573K.
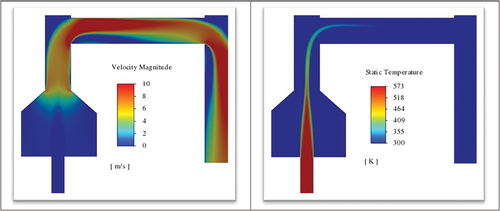
Figure 4. Lab-1 Turbulent intensity contours (left) and the particles concentration contours (right). Non-dimensional particle concentration at the stack inlet is assumed to equal one.
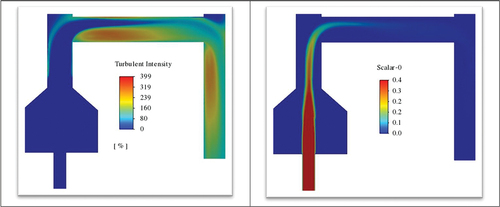
Figure 5. Lab-1 particle concentration profiles at the tunnel outlet. Non-dimensional particle concentration at the stack inlet is one.
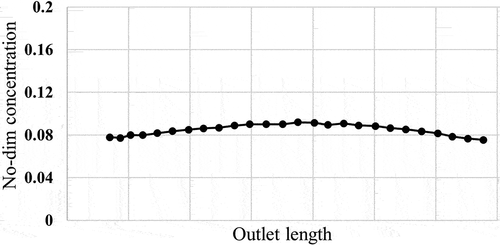
Figure 6. Lab-2 dilution tunnel configuration with elbows.
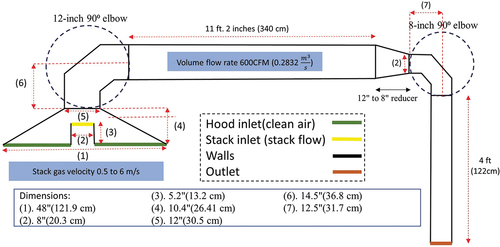
Figure 7. Lab-2 tunnel elbow and reducer dimensions.
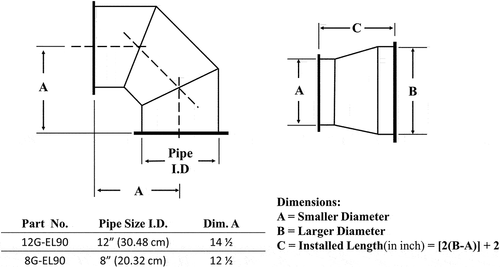
Figure 8. Lab-2 tunnel with elbows. Velocity magnitude contours at the midsection of dilution tunnel for V=1.5 m/s at stack inlet.
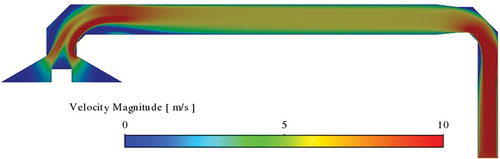
Figure 9. Lab-2 with elbows. Particle concentration contours at the midsection of the dilution tunnel. Here a uniform concentration at the stack inlet to the tunnel is assumed.
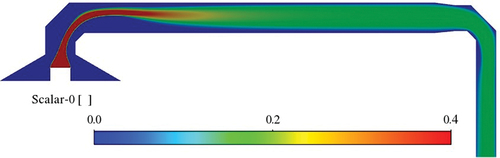
Figure 10. Lab-2 with elbows. Particle concentration profiles at the outlet. Here a uniform concentration at the stack inlet to the tunnel is assumed.
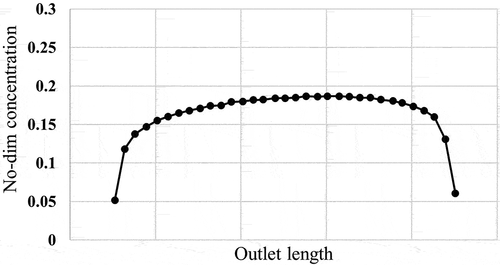
Figure 11. Experimental data for Lab-2 tunnel concentration and stack temperature.
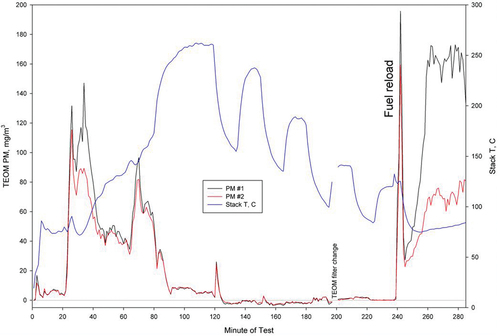
Figure 12. Lab-2 configuration with two elbows. Velocity magnitude contours at the midsection of the dilution tunnel. Here the stack inlet velocity is V=6m/s.
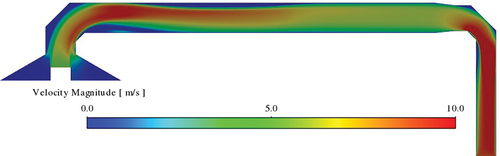
Figure 13. Lab-2 configuration with two elbows. Turbulence intensity contours at the midsection of the dilution tunnel.
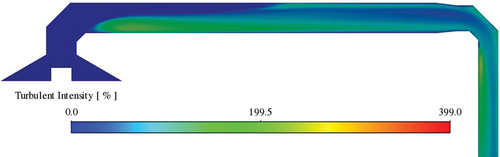
Figure 14. Lab-2 configuration with two elbows. Temperature contours at the midsection of the dilution tunnel. Here the stack inlet temperature is T=573k.
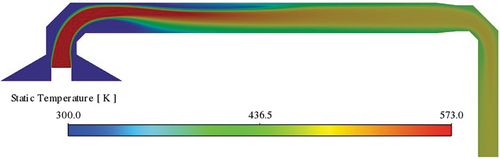
Figure 15. Lab-2 configuration with two elbows. Particle concentration contours at the midsection of the dilution tunnel. Here a highly non-uniform concentration at the stack inlet to the tunnel is assumed.
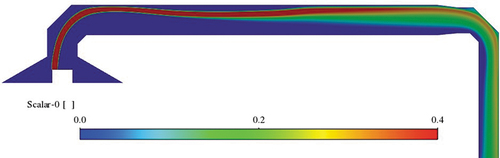
Figure 16. Lab-2 tee configuration.
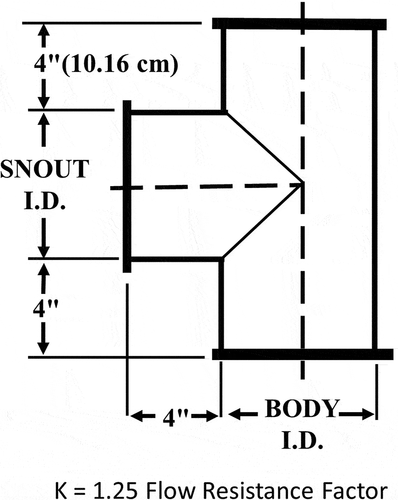
Figure 17. Lab-2 configuration with elbow and tee. Velocity magnitude contours at the midsection of the dilution tunnel. Here the stack inlet velocity is V=6m/s.
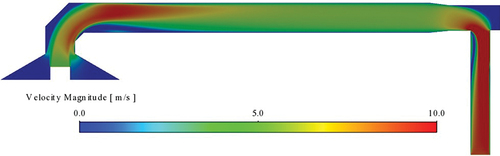
Figure 18. Lab-2 configuration with elbow and tee. Turbulence intensity at the midsection of the dilution tunnel.
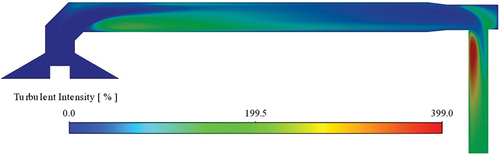
Figure 19. Lab-2 configuration with elbow and tee. Temperature contours for at the midsection of the dilution tunnel. Here the stack inlet temperature is T=573k.
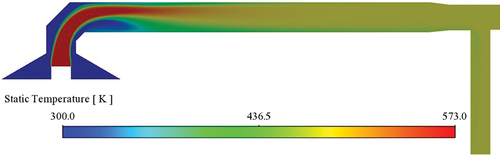
Figure 20. Lab-2 configuration with elbow and tee. Particle concentration contours at the midsection of the dilution tunnel. Concentration at the stack inlet to the tunnel is highly non-uniform.
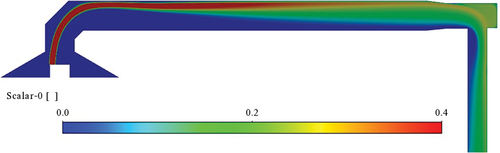
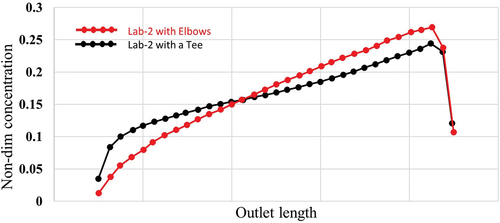
Figure 21. Comparison of particle concentration profiles at the tunnel outlet for the Lab-2 tunnels with elbow and tee. Red dots present the Lab-2 tunnel with two elbows (case 1), and the black line represents the Lab-2 tunnel with elbow and tee (case 2).