
Figures & data
Table 1. Hydronic heater descriptions.
Figure 1. Schematic diagram of wood-fired hydronic heater experiment. Boiler device schematic adapted with permission from (Siegenthaler Citation2017).
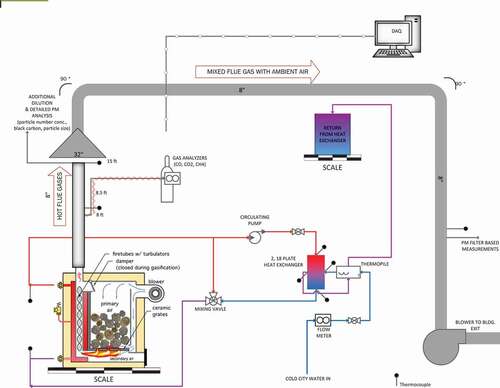
Table 2. Multi-Phase testing protocol.
Table 3. Fuel charge description with size and fuel charge mass specification used for each appliance during each fuel loading event within the test method.
Table 4. Phase Weighting Factor.
Figure 2. Coefficient of variation heat map for burn rate, particulate matter (PM) emission factor, and efficiency for Hydronic Heater A and B.
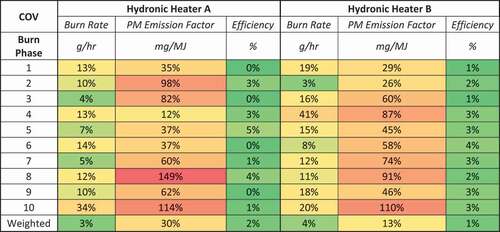
Figure 3. Heat map with average particulate matter (PM) emission factor, emission rate, and emission index for each phase of the operating protocol for both hydronic heaters.
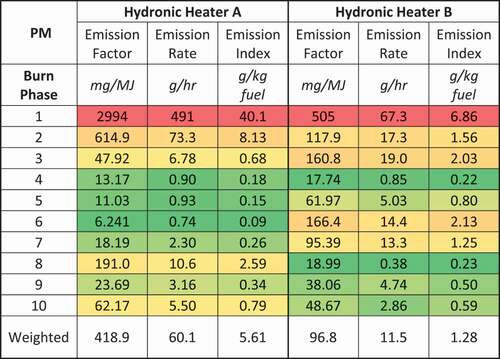
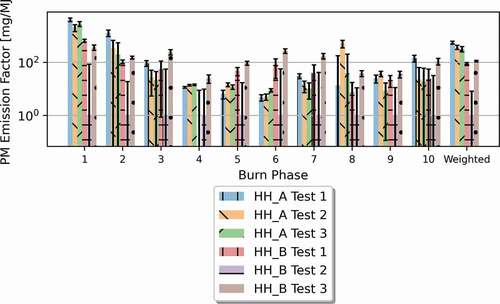
Figure 4. Bar chart showing the particulate matter (PM) emission factor (EF), in units of milligrams of particulate matter per megajoule of energy output (mg/mj), calculated for each experiment during triplicate testing of Hydronic Heater A (HH A).
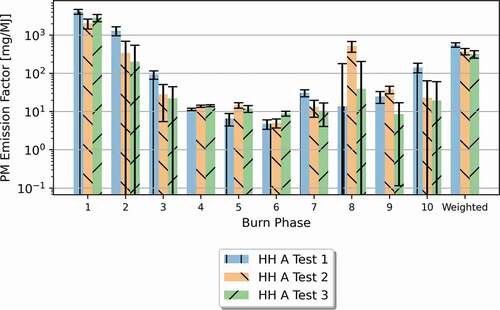
Figure 5. Bar chart showing the particulate matter (PM) emission factor (EF), in units of milligrams of particulate matter per megajoule of energy output (mg/mj), calculated for each experiment during triplicate testing of Hydronic Heater B (HH B).
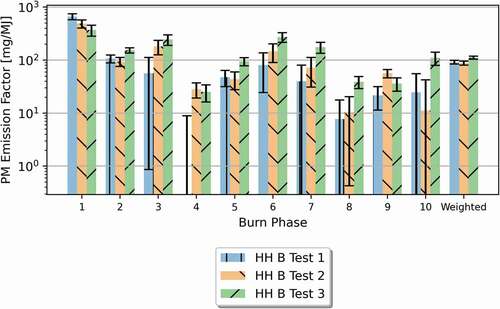
Figure 6. Heat map with average carbon monoxide (CO) emission factor, emission rate, and emission index for each phase of the operating protocol for both hydronic heaters.
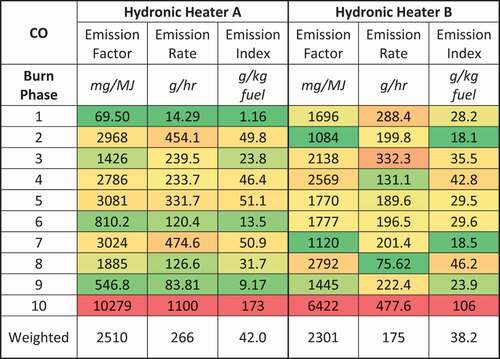
Figure 7. Bar chart showing the carbon monoxide (CO) emission factor (EF), in units of milligrams of CO per megajoule of energy output (mg/mj), calculated for each experiment during triplicate testing of Hydronic Heater A (HH A).
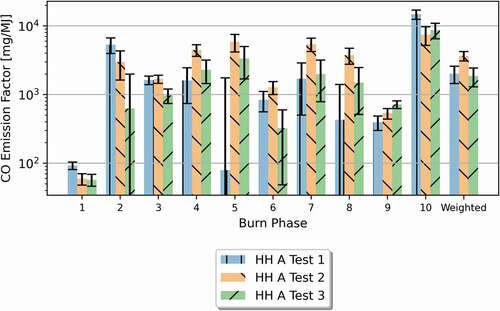
Figure 8. Bar chart showing the carbon monoxide (CO) emission factor (EF), in units of milligrams of CO per megajoule of energy output (mg/mj), calculated for each experiment during triplicate testing of Hydronic Heater B (HH B).
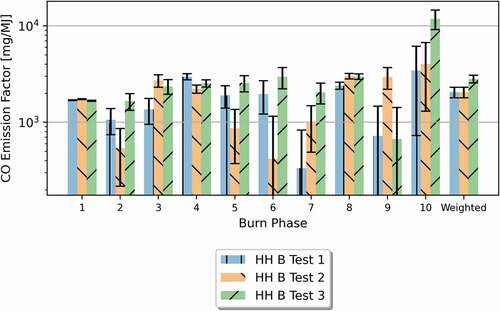
Figure 9. Heat map of average methane (Ch4) emission factor, emission rate, and emission index) for each phase of the operating protocol for both hydronic heaters.
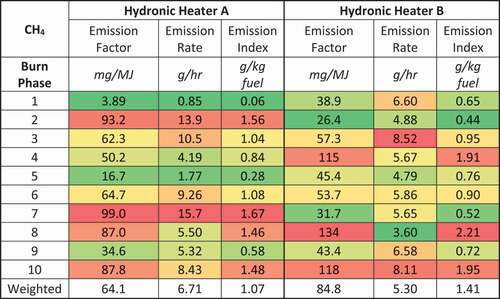
Figure 10. Bar chart showing the methane (Ch4) emission factor, in units of milligrams of CH4 per megajoule of energy output (mg/mj), calculated for each experiment during triplicate testing of Hydronic Heater A (HH A).
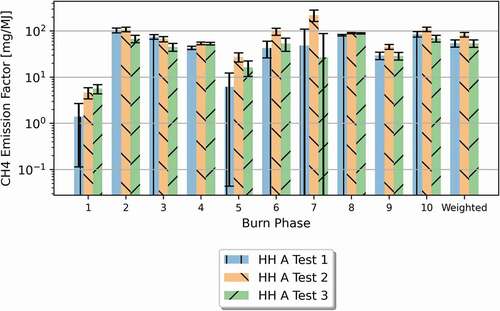
Figure 11. Bar chart showing the methane (Ch4) emission factor, in units of milligrams of CH4 per megajoule of energy output (mg/mj), calculated for each experiment during triplicate testing of Hydronic Heater B (HH B).
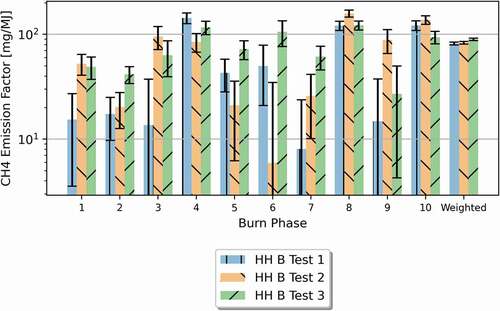
Figure 12. Heat map of Appliance A and B average black carbon (BC) emission factor, emission rate, and emission index for each test phase of the operating protocol.
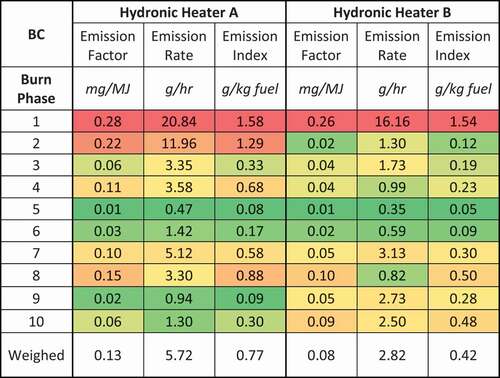
Figure 13. Heat map of Appliance A and B calculated efficiency for each phase of the operating protocol.
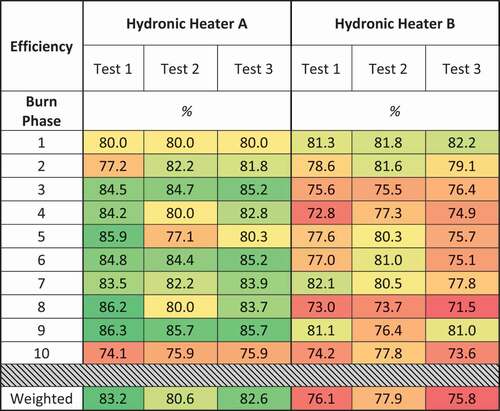
Table 5. Annual average emissions and efficiency from both hydronic heaters.
Figure 14. Bar chart comparing the PM EF (mg/mj) calculated for each experiment during triplicate testing for hydronic heating Appliances A and B.
SUPPORTING_INFORMATION_20211008.docx
Download MS Word (195.3 KB)Data availability statement
The data that support the findings of this study are available from the corresponding author, R. Trojanowski, upon reasonable request.