
Figures & data
Figure 1. Map showing the study region, including the monitoring site, nearby population centers, oil and gas wells, and major roads. DINO is located near the edge of oil and gas activities. In the inset, an outline of the larger Uinta-Piceance boundary is shown in black.
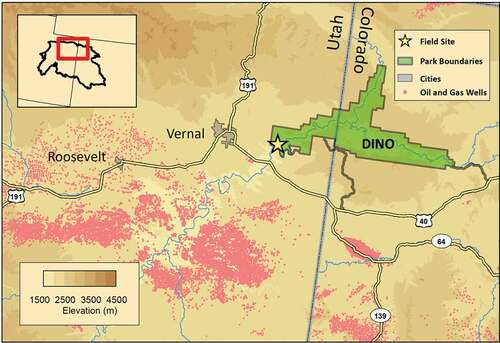
Figure 2. Timeline of 8-h average ozone mixing ratios from DINO from 2015 to 2020. Winter periods (21 December to 21 March) are shaded in the figure, the study period is outlined in blue, and the EPA’s NAAQS for ozone (70 ppbv) is shown as a dotted red line.
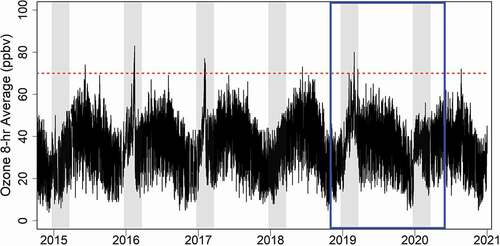
Figure 3. (A) Total VOCs (blue) measured during the intensive study period from 20 November 2019 to 06 May 2020. Note that 1 in 3 VOC samples were missing for much of the study period due to an improperly configured valve. Also shown is PM2.5 mass (red) at the DINO site. (B) Daily averaged snow depth (cm) measured in Vernal, UT, wind speed (m/s) at the DINO sampling site and mixing depth (m) from NAM12.
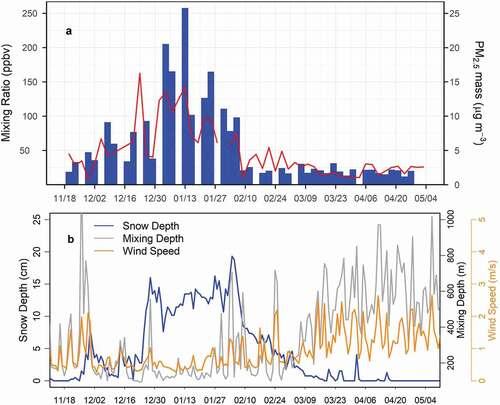
Figure 4. I-pentane versus n-pentane, colored by ethane mixing ratios. Also shown are i- to n-pentane ratios from a number of other areas.
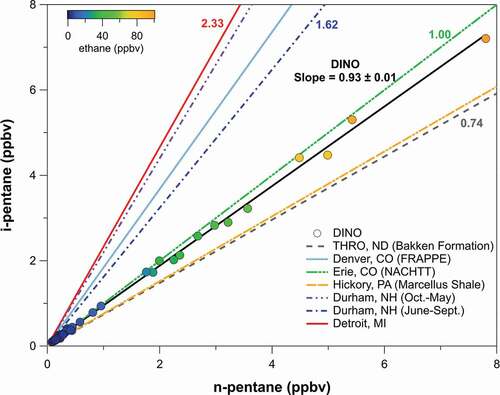
Figure 5. Average contribution of key VOC classes for three sampling periods. The fractional VOC contribution is on the left axis, while the black points represent the average combined VOC-OH reactivity of the classes listed on the right axis.
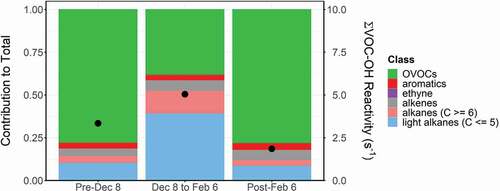
Figure 6. Timeline of IMPROVE speciated aerosol data from DINO from November 2018 to May 2020. Also shown is calculated light extinction from particles (bext, p) calculated from the IMPROVE data.
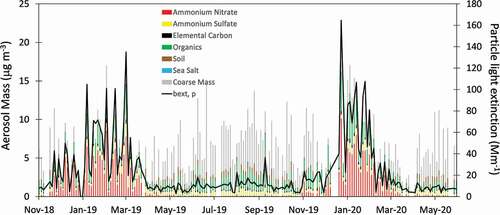
Figure 7. Photos from the NPS air quality webcam network taken in (A) winter (7 January) and (B) summer (27 June) 2019. Both images were taken at 13:45 MST.
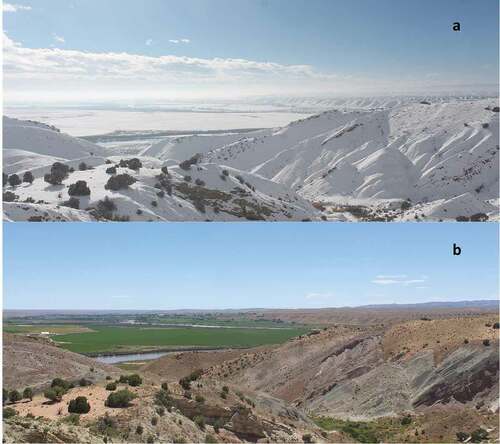
Figure 8. Coarse mode species determined for part of the study. Coarse-mode composition was only measured for part of the study, and carbon fractions were not measured. Although classified here as ammonium nitrate, the coarse nitrate is more likely composed of nitrate associated with reacted soil dust.
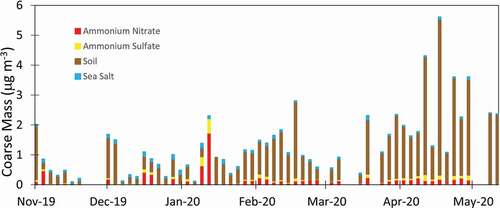
Figure 9. Weekly integrated samples from the denuder/filter-pack. (A) ammonia (NH3), particulate ammonium (NH4+) and the ratio of oxidized to reduced nitrogen (N ratio); (B) nitric acid (HNO3) and particulate nitrate (NO3−); and (C) sulfur in the form of sulfur dioxide (SO2) and sulfur in the form of particulate sulfate (SO42-).
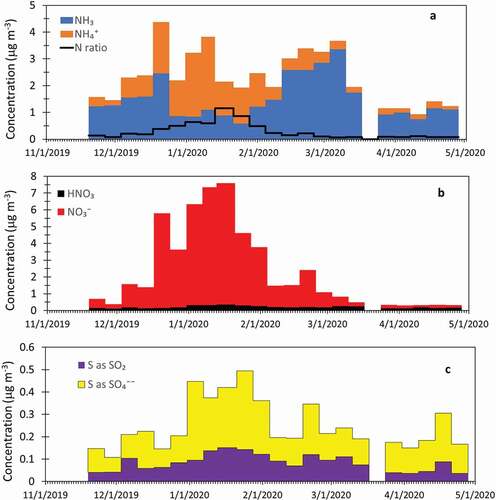
Figure 10. Comparison of the two winter periods, including (A) reconstructed fine mass from the IMPROVE network (24-h) and weekly averaged temperature; (B) 8-h averaged ozone from the NPS GPMP; (C) weekly averaged snow depth from Vernal, UT, and wind speed from the on-site met station; and (D) weekly averaged mixing depth from NAM-12 and solar radiation from the on-site met station.
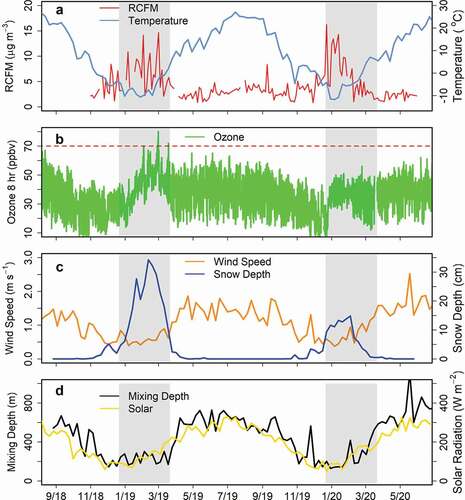
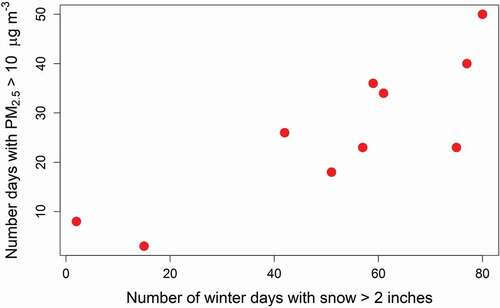
Figure 11. Number of days in Vernal each winter with PM2.5 > 10 μg m−3, relative to the number of days with more than 2 inches of snow depth.
Data availability statement
Much of the data that support the findings of this study are openly available at
The data that support the findings of this study that are not publicly available are available from the corresponding author, AJP, upon reasonable request.