
Figures & data
Figure 1. Crib wood species total PM (a) emission factors (g/kg) and (b) emission rates (g/h) (Hearthlab Solutions Citation2017).
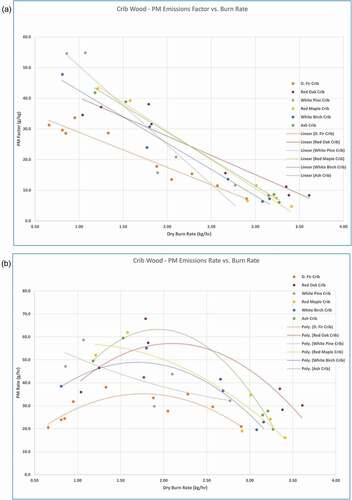
Table 1. Characteristics of cordwood stoves used for species and moisture tests.
Table 2a. Cordwood stove species tests.
Table 2b. Tests evaluating impact of MC (%, dry basis) on cordwood stove performance.
Figure 2. Distribution of MCs in fuel pieces used in moisture experiments (error bars represent 95% confidence intervals).
Table 3. Summary of IDC cordwood protocol.
Table 4. Pellet composition and tests.
Table 5. Effect of fuel MC on emissions and efficiency – mean [range].
Figure 3. (a) Comparison of PM emission rates (g/h), (b) emission factors (g/kg) and (c) HHV efficiencies (%) in wet and dry fuel (average, minimum, and maximum).
Figure 4. Comparison of Stove 6 (a and b) and Stove 7 (c and d) wet and properly seasoned (dry) wood emission rates and emission factors by IDC phase (average, minimum, and maximum).
Table 6. Stove 6 ASTM E3053 PM emission rates (g/h) by fuel species.
Figure 5. IDC runs with different fuel species for Stoves 6, 7, and 15: (a) PM emission rates, (b) PM emission factors, (c) HHV efficiencies (average, minimum, and maximum).
Figure 6. (a) PM Emission rates and (b) emission factors by stove and pellet (where available, error bars indicate minimum and maximum).
Figure 7. Stove 11, 15-minute running average TEOM PM rate with soft and hardwood pellets.
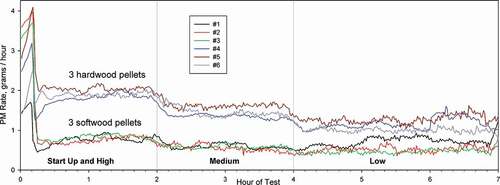
Figure 8. PM EF vs. pellet ash content for three soft and three hardwood pellets.
Data availability statement
The data that support the findings of this study are available from NESCAUM upon reasonable request to NESCAUM’s Executive Director.