
Figures & data
Table 1. Morin IDC Stove Paper Tables Cordwood stoves in initial research program.
Table 2. Additional cordwood stoves certified with the ASTM E3053 method.
Table 3. Tests conducted.
Table 4. Method development assessments.
Table 5. Average times to 90% and 100% fuel consumption by test protocol and stove.
Table 6. Emission factors and rates at 100% and 90% combustion and percent differences.
Figure 1. Bottom-up versus top-down startup configuration metrics: (a) run time and (b) dry burn rate.
Figure 2. Bottom-up versus top-down startup configuration PM emission metrics: (a) emission factor (g/kg) and (b) emission rate (g/h).
Table 7. Comparison of high-fire phase metrics in runs with different fuel loads.
Figure 3. PM emissions in high-fire phases with and without air setting switched to low.
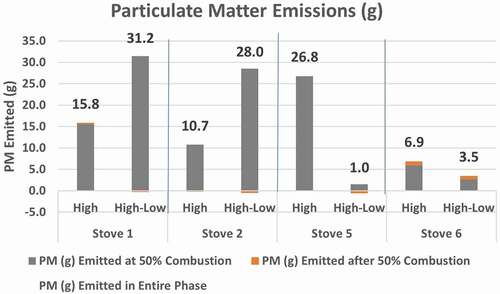
Figure 4. Stove temperature in high-fire phases with and without air setting switched to low.
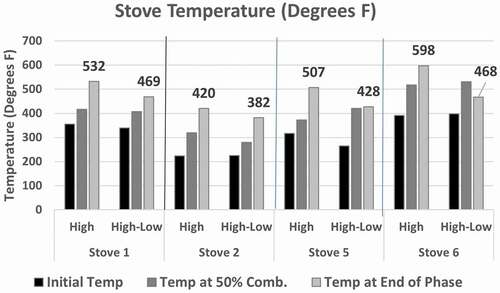
Figure 5. Stove temperatures (°F) at the beginning of low and medium burns – Method 28 R and ASTM E3053.
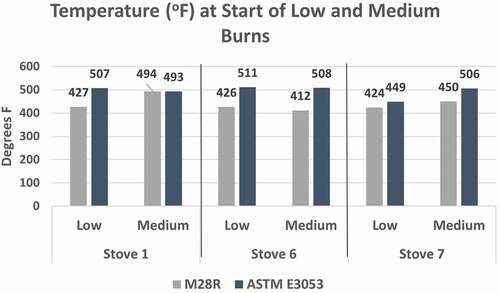
Figure 6. Stove temperatures (°F) at the beginning of low burn phase when that phase was and was not preceded by a maintenance phase.
Figure 7. PM emissions at medium and low air settings: (a) emission factor (g/kg) and (b) emission rate (g/h).
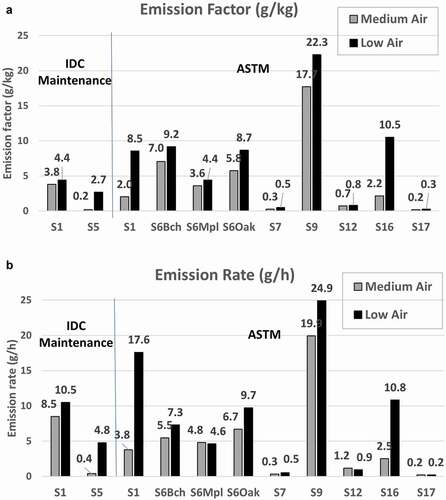
Table 8. Impact of startup phase on total PM emissions and PM ER in stoves with lowest and highest emission rates: mean and [range].
Figure 8. Fuel combustion (a) and stove temperature (b) curves in Stove 2 startup phases by door position in the first five minutes of the test run.
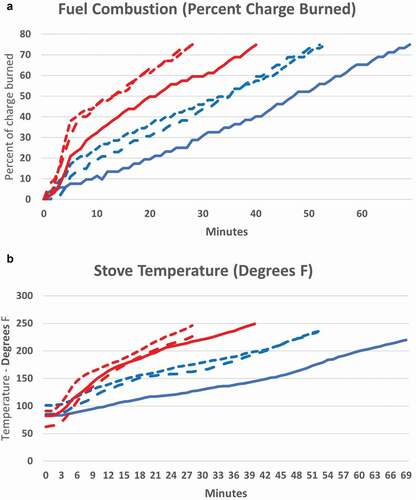
Table 9. Mean and relative standard deviation of emission rates and emission factors in triplicate IDC tests.
Figure_S-5.jpg
Download JPEG Image (188.2 KB)
Figure_S-4.jpg
Download JPEG Image (160.8 KB)
Figure_S-3.jpg
Download JPEG Image (142.2 KB)
Figure_S-2b.jpg
Download JPEG Image (150 KB)
Figure_S-2a.jpg
Download JPEG Image (129.5 KB)
Figure_S-1.jpg
Download JPEG Image (130.3 KB)
IDC_Stove_Supplemental_Info_Text.docx
Download MS Word (33.3 KB)Data availability statement
The data that support the findings of the study reported in Development of an Integrated Duty Cycle Test Method to Assess Cordwood Stove Performance are available from the corresponding author, BM, upon reasonable request.