
Figures & data
Figure 1. Location of the Chengdu in China and three-dimensional terrain in the Chengdu and its surrounding areas.
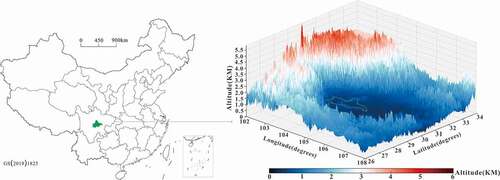
Figure 2. Variation Characteristics of daily average AQI concentration, distribution of pollution days and proportion of AQI grade in Chengdu from 2015 to 2018.
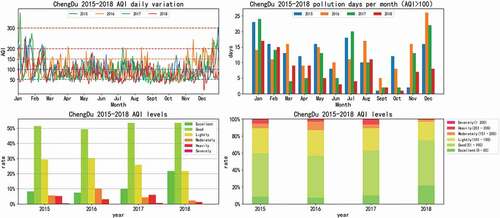
Table 1. Random forest classification of air pollutants in Chengdu 2017.
Table 2. Basic concentration limit of ambient air pollutants.
Figure 3. Classification frequency chart of air pollutants in Chengdu 2017.
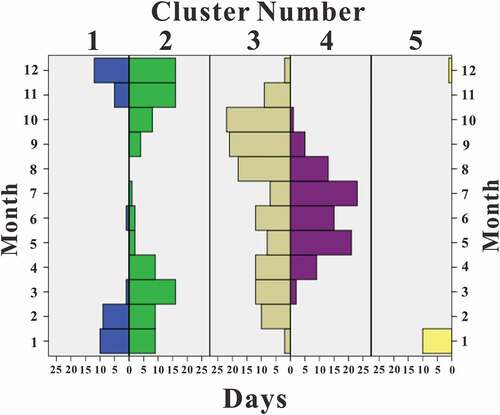
Figure 4. The air spatio-temporal trajectories of each pollution period in Chengdu 2017.
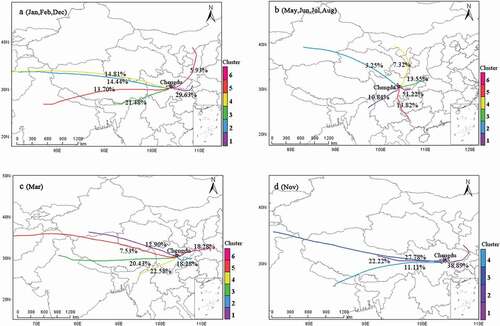
Figure 5. The pollutants (PM2.5, PM10 and NO2) of occurrence probability and corresponding concentration of each air trajectory during serious pollution period in Chengdu 2017.
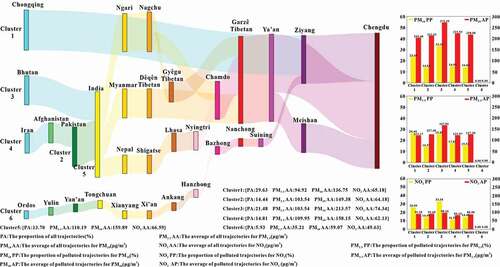
Figure 6. The O3 of occurrence probability and corresponding concentration of each air trajectory during O3 pollution period in Chengdu 2017.
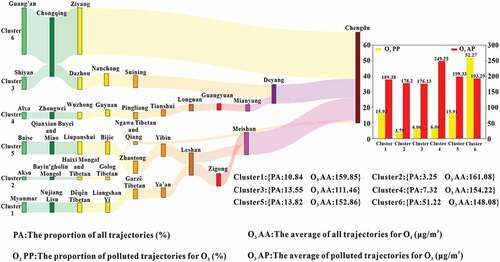
Figure 7. The pollutants (PM2.5, PM10) of occurrence probability and corresponding concentration of each air trajectory during slight pollution period in Chengdu 2017.
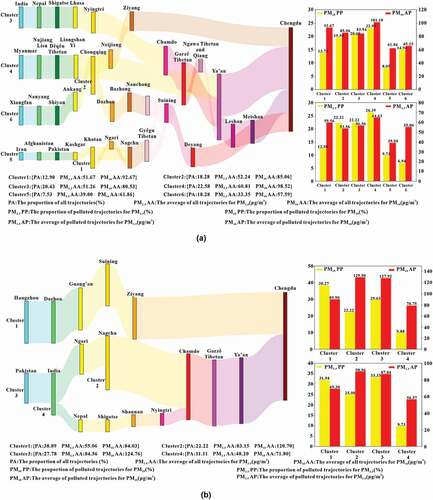
Figure 8. Spatial distribution of WPSCF and WCWT values of PM2.5, PM10 and NO2 of serious pollution period in Chengdu 2017.
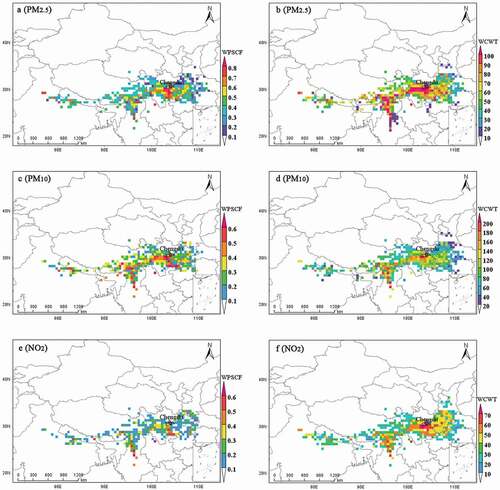
Figure 9. Spatial distribution of WPSCF and WCWT values of O3 of Ozone pollution period in Chengdu 2017.
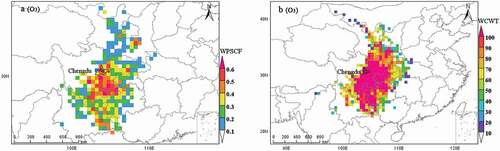
Figure 10. Spatial distribution of WPSCF and WCWT values of PM2.5 and PM10 of light pollution period in Chengdu 2017.
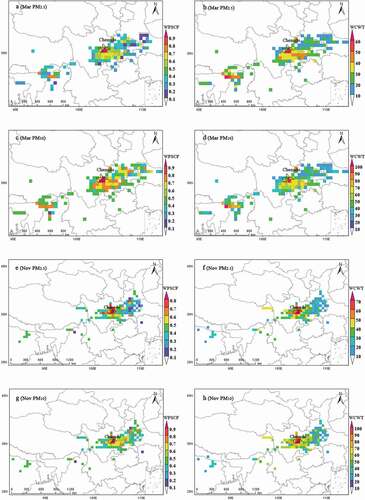
Figure 11. The hourly, daily and monthly variations of PM2.5, PM10, NO2 and O3 in Chengdu in 2017.
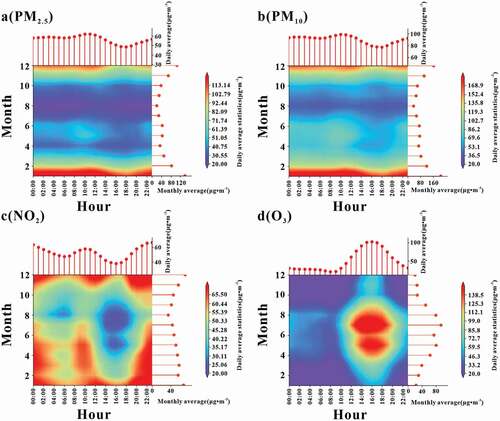
Figure 12. The hourly variation of meteorological data (temperature, relative humidity, and wind speed), AOD, PBLH and pollutant gases (PM2.5, PM10, NO2 and O3) in Chengdu 2017.
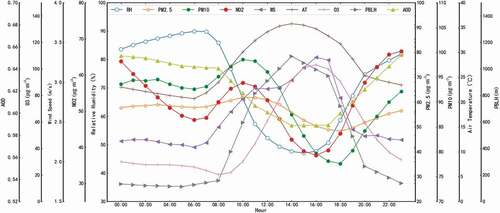
Figure 13. Distribution of thermal anomalies in typical industrial areas: a is a cement plant; b is a steel plant; c is a manufacturing plant.
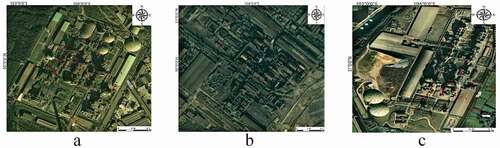
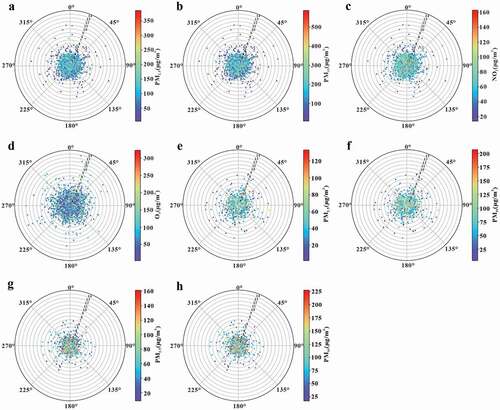
Figure 14. Hourly distribution relationship between wind speed and pollution in each pollution period.
Supplement.jpg
Download JPEG Image (1.9 MB)
Data availability statement
The data that support the findings of this study are available from the corresponding author upon reasonable request. http://sweb.cdutetc.cn/tmgc/wxj/20220407.rar