
Figures & data
Table 1. Epsilon 5 application used to analyze samples.
Figure 1. The variance of deposit normalized to average loadings (Var(dep)/CME) of selected elements on the ME set.
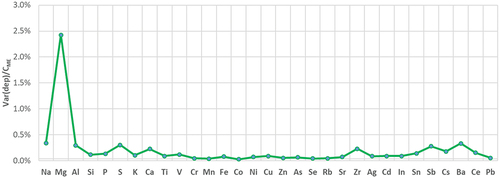
Table 2. The comparison of MDLLB and MDLME along with current reported MDL (MDLFB, will be discussed later) and MDL estimated by 3-sigma-criterion from the literature (all MDL values have units of ng cm-2, n.a. refers to not available). Elements with asterisks (*) have CME/MDLLB outside of the recommended 2–10 × MDL range. Note MDLLB and MDLME were determined in 2018, while MDLFB was determined in 2020. The greater than (>) signs indicate elements where MDLLB exceeded MDLME.
Figure 2. The average elemental loadings (CME) normalized to MDLLB ratios (CME/MDLLB) for the ME set. Note: P and S have MDLLB of 0, so their CME/MDLLB values are not shown. Horizontal lines are upper and lower limits recommended in the EPA procedure.
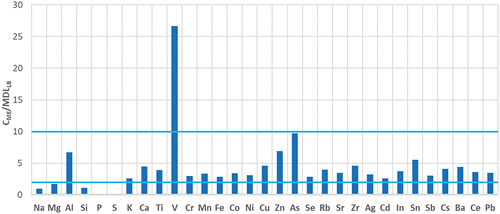
Figure 3. Ratios of MDLs acquired in 2021 for annual verifications to those acquired in 2018 right after generation. Elements marked with triangles have CME/MDLLB outside of 2–10.
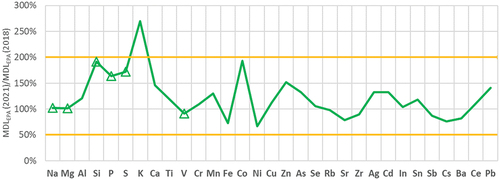
Figure 4. Comparison of MDLEPA(2021) and MDLFB(2020). Elements are in order of low to high atomic number (Z).
Figure 5. Comparison of three different approaches for estimating MDL: MDLEPA(2021), MDLrep-blk(2019) and MDLrep-ME(2021).
Data availability statement
The data that support the findings of this study are available from the corresponding author, NPH, upon reasonable request.