
Figures & data
Table 1. Comparison of test methods for wood-fired central heaters used in U.S. regulations.
Figure 1. Schematic of wood gasification boiler with thermal storage (Siegenthaler Citation2017).
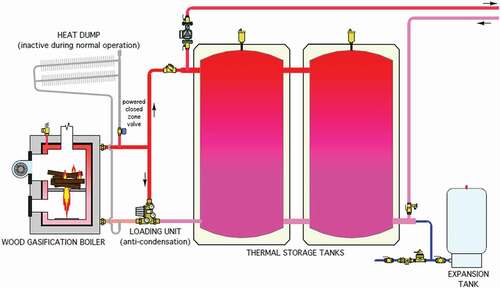
Table 2. Summary of research plan.
Figure 2. Kindling configuration #1, #2, and #3.
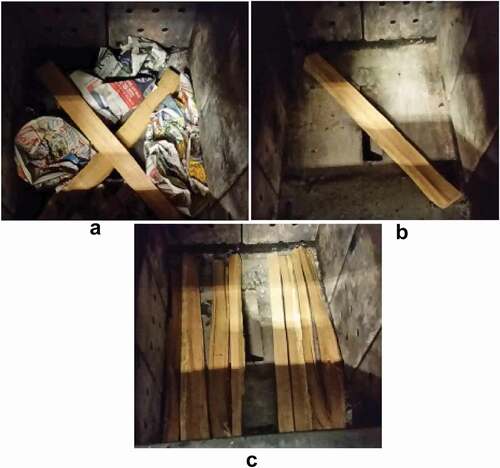
Table 3. Results from test series #1.
Figure 3. Real-time PM Emissions Series #1-configuration 1.
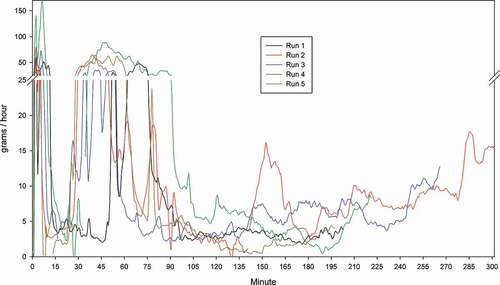
Figure 4. Real-time PM Emissions Series #1-configuration 2.
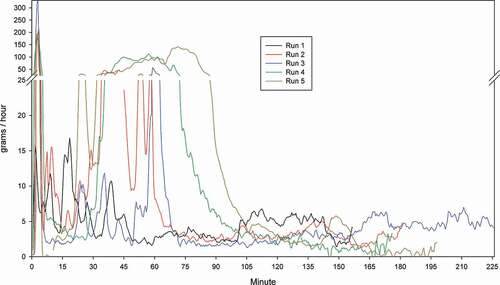
Figure 5. Real-time PM Emissions Series #1-configuration 3.
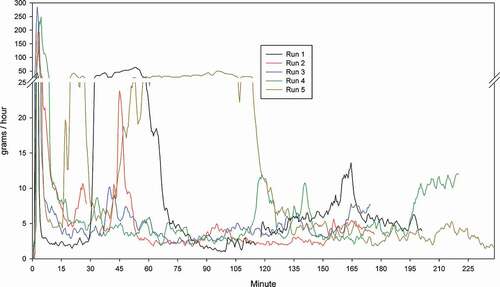
Figure 6. Real-time PM emissions test series #2.
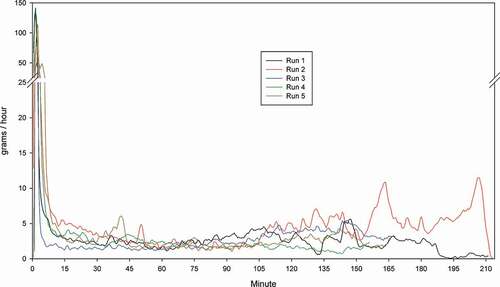
Figure 7. CO profile Test Series #2.
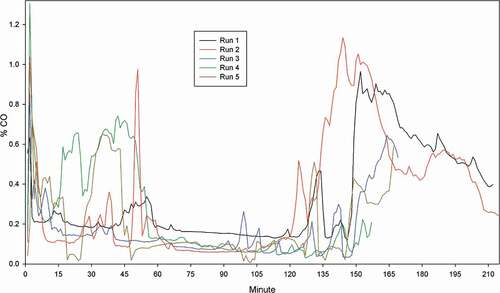
Figure 8. Real-time PM emissions test series 3.
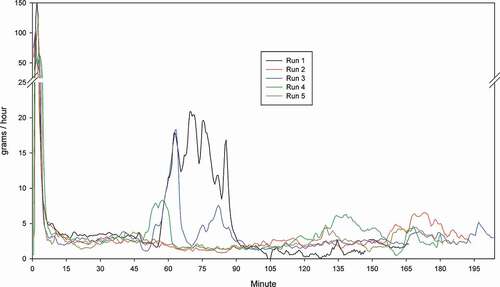
Figure 9. CO profile test series #3.
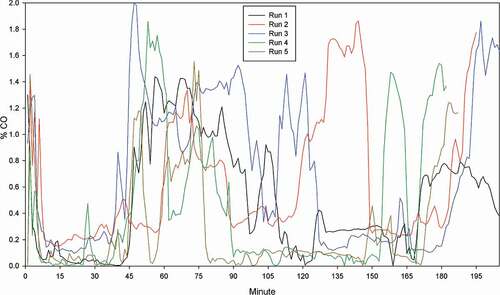
Table 4. Results from Test Series 2.
Table 5. Results from test series 3.
Table 6. Results for test series #4.
Figure 10. Real-time PM emissions from Test Series 4.
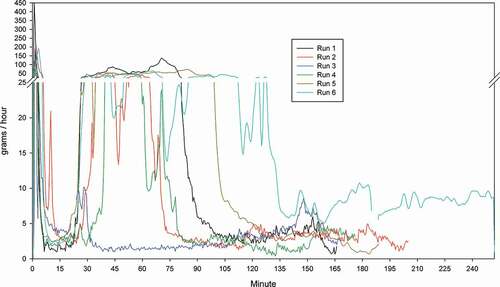
Figure 11. Comparison of fuel shapes.
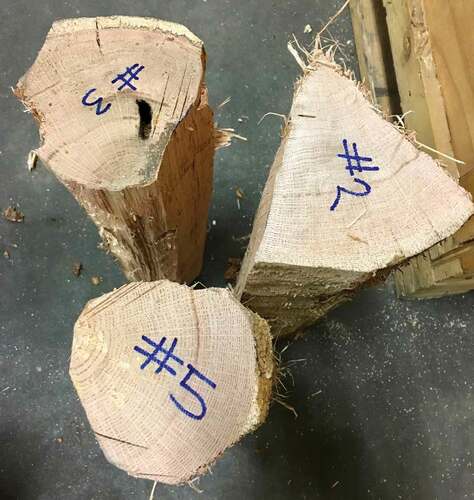
Figure 12. Real-time PM emissions from Test Series 5.
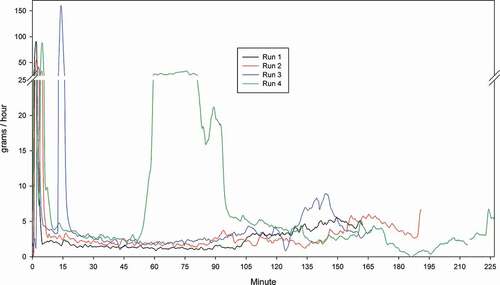
Table 7. Results for Test Series #5.
Figure 13. Test series summary – average PM rates per replicate.
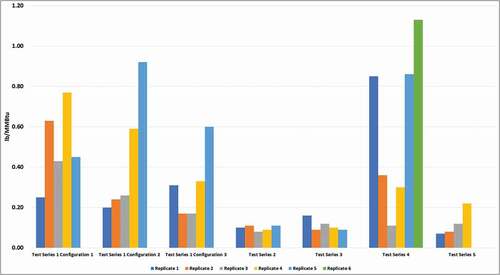
Figure 14. CO and PM comparison among test series.
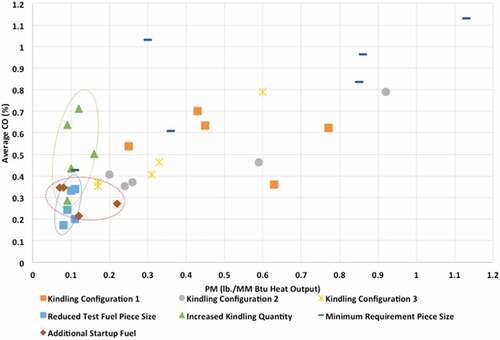
Table 8. Summary of test series results: PM, CO, and variability.
Impact_of_Fueling_Protocols_on_Emission_Outcomes_for_Certification_Testing_of_Residential_Wood_Heaters_figures_list_3_22_2022.docx
Download MS Word (41 KB)Data availability statement
The data that support the findings of this study are available from NESCAUM upon reasonable request to NESCAUM’s Executive Director.