
Figures & data
Table 1. Descriptive statistics.
Table 2. Estimates of the input distance function.
Table 3. Summary statistics of efficiency estimation and shadow price of residual waste for Chilean municipalities analyzed.
Figure 1. Histogram showing the distribution of technical efficiency scores for the Chilean municipalities evaluated.
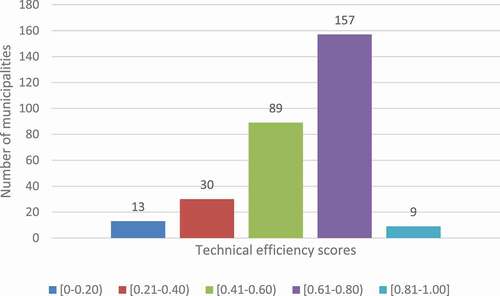
Figure 2. Histogram with distribution of estimated shadow prices of residual waste (US $/kilogram) for the Chilean municipalities.
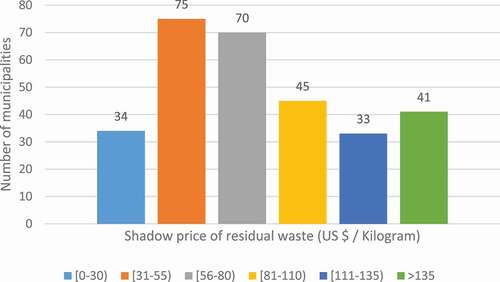
Table 4. Technical efficiency and shadow price of residual waste based on population density.
Table 5. Efficiency and shadow price of reducing residual waste by Chilean region.