
Figures & data
Table 1. Summary of selected low-cost PM sensor validation studies. Values are for ambient air measurements unless otherwise stated. The R2 and mean absolute error (MAE) values for PM2.5 and PM10 are from the comparison of the low-cost sensor to a reference sensor. MAE values are included when reported.
Table 2. Table of the sensors and data available for comparison. All sensors are located at the Parklane site in Columbia, SC.
Table 3. Mean (SD = standard deviation) of the relative error of strict hourly measurements from LCS compared to the FEM for each time period. The LCS values in this table have not yet been bias adjusted, as can be seen in the high relative error for LCS A from Aug. 22–Oct. 5 (−0.75) and LCS C from Sep. 13–Dec. 12 (−0.36).
Figure 1. Panel a is the raw PM2.5 and Panel b is the raw PM10 concentration (µg/m3) data from the sensors at the Parklane site in Columbia, SC from August to December 2019. Sensors include FRM, FEM, LCS A, LCS B, and LCS C. 68 negative values from the FEM, on the PM2.5 plot were not included.
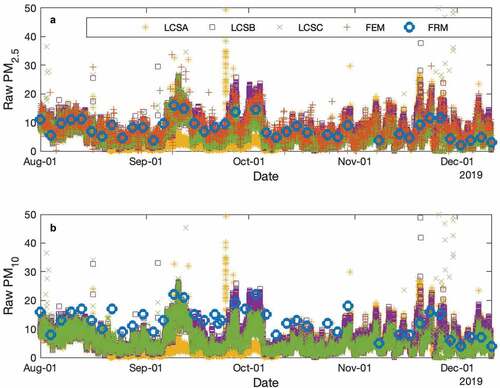
Figure 2. A pairwise comparison plot of the strict hourly PM2.5 concentration measurements from the LCSs. Panel a shows the comparison of LCS A and B with three distinct trendlines indicting different date ranges; the yellow asterisks represent Jul.29 to Aug. 21, the orange squares indicate Aug. 22 – Oct. 5, and the blue circles indicate the time period from Oct. 9 – Dec. 12. Panel b shows a pairwise comparison of LCS B and C; the blue circles indicate the time frame from Jul. 29 to Sep. 13 and the red crosses indicate Sep. 16 – Dec. 12.
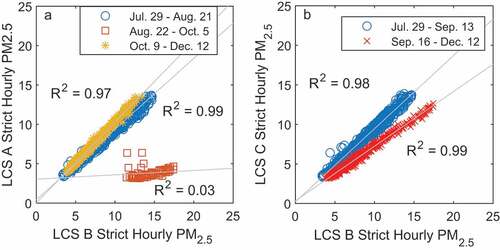
Figure 3. Plot of the relative error of trimmed daily measurements of the low-cost sensors versus the FEM at the Parklane site in Columbia, SC. Includes 93 values for each sensor.
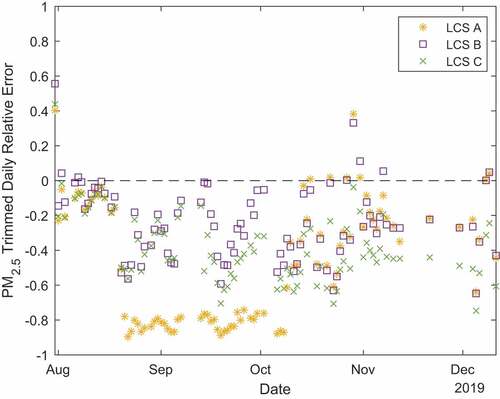
Table 4. Linear regression summary for trimmed daily bias adjusted sensor measurements versus FEM.
Figure 4. A four-panel plot of the FEM versus the daily measurements for the FRM and LCSs. Panel a is a plot of 45 measurements between the FEM vs the FRM. Panels b, c, and d are of the FEM versus LCS A, B, and C respectively, and plots 93 trimmed bias adjusted daily measurements. Horizontal error bars represent the accuracy of the FEM +/- 0.75% while the vertical error bars represent the standard deviation of the average hourly measurements for the LCSs. The linear fit line is solid black and the 1:1 line is dashed.
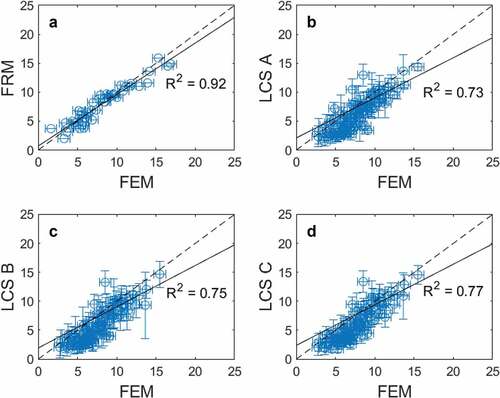
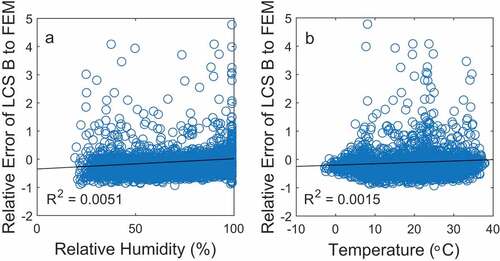
Figure 5. The ratio of hourly trimmed measurements of LCS B to the FEM plotted versus Relative Humidity (%) and Temperature (°C). This figure includes 2764 measurements, more than the 2300 measurements evaluated otherwise as these are only the measurements that are from LCS B compared to the FEM.
Applied_LowCostSensorPaperSupplemental
Download MS Word (998.5 KB)Data availability statement
The data that support the findings of this study are available from the corresponding author, ARM, upon reasonable request.