
Figures & data
Table 1. Definitions and encoding of input features of the machine learning models.
Table 2. IAQ satisfaction response encoding.
Figure 1. Questions and possible responses regarding participant sleep quality included on morning EMAs sent four times during the week.
Figure 2. The BEVO Beacon and sensors included on the device.
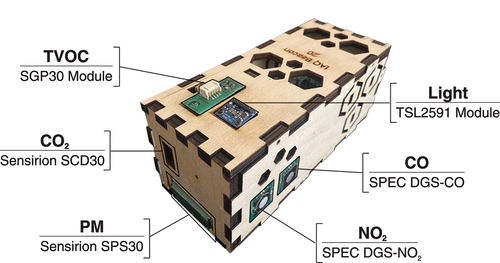
Table 3. Recommendations used to encode the sleep metrics self-reported on EMAs.
Table 4. Results from 5-fold cross validation and test scores of classifiers trained on varying combinations of features and targets.
Figure 3. Cumulative distribution plots for the feature values used to predict perception of IAQ. Each plot shares the same y-axis values. The first six features represent those related to IAQ while the remaining three, pictured at the bottom, are related to the mechanical or natural ventilation system.
Table 5. Performance metrics of ML models when predicting perception of IAQ.
Figure 4. Correlation matrix of the selected nine features used to predict IAQ satisfaction.
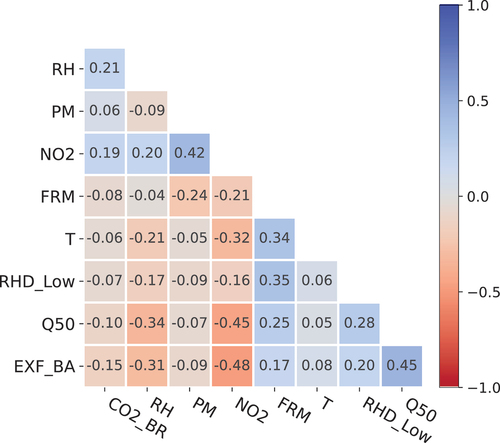
Figure 5. Relative feature importance when predicting perception of IAQ from the Decision Tree (DT) and Random Forest (RF) models.
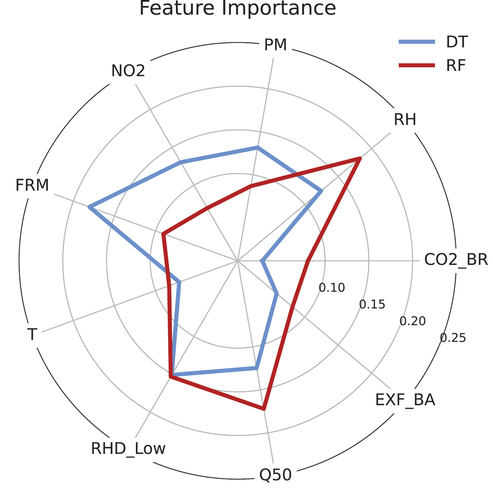
Figure 6. Relationship between RHD_Low, Q50, RH and class of IAQ satisfaction (Class 0 – lower IAQ satisfaction, Class 1 – high IAQ satisfaction).
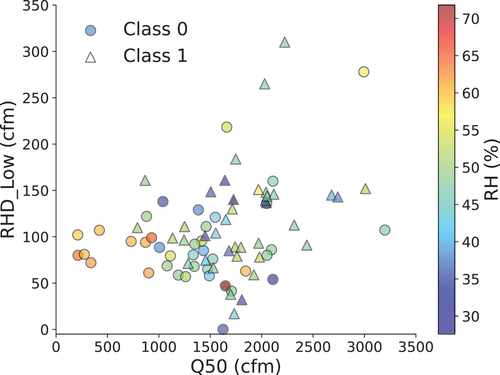
Figure 7. Cumulative distribution plots for the feature values used to predict sleep quality perceptions. Each plot shares the same y-axis values.
Table 6. Performance of ML models when predicting self-reported sleep metrics.
Table 7. Feature importances from DT and RF models.
Data Availability Statement
The data that support the findings of this study are available from the corresponding author, HF, upon reasonable request. Data for the first analysis on IAQ and IAQ satisfaction has also been made publicly available by authors in [19] and [20].