
Figures & data
Figure 1. Site description; (a) Location and aerial image map of the study area showing ERT profile locations and EMP-400 profiler measurement points, (b) Map of MSW disposal facility of the Nonthaburi provincial administrative organization, Khlong Khwang subdistrict, Sai Noi district, Nonthaburi province, Thailand, and (c) Images showing surface conditions of each profile.
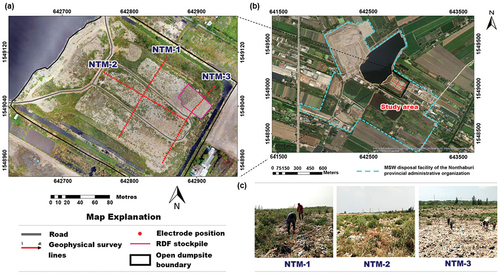
Figure 2. The electrode positions for the Wenner–Schlumberger configuration of the ERT survey.
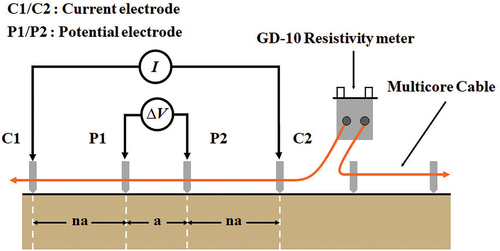
Table 1. Arrangement of the frequency set of FDEM surveys.
Figure 3. Flowchart showing the selection process of an optimum frequency set.
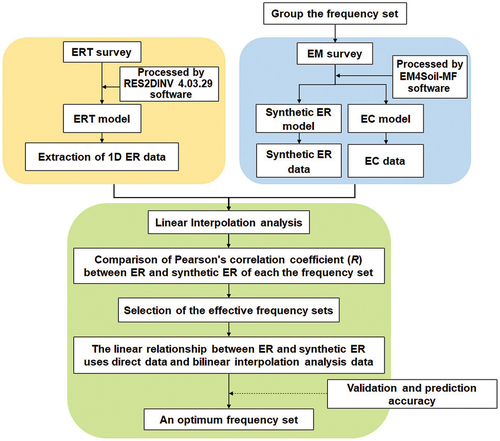
Figure 4. Inverted ERT model for profiles (a) NTM-1, (b) NTM-2, and (c) NTM-3. Adapted with permission from “Applying electromagnetic surveys as pre-screening tools prior to open dump mining,” by Boonsakul et al. (Citation2021), J mater cycles waste manag 23, 1518–1530. Copyright (2021) by Springer Japan KK, part of Springer nature.
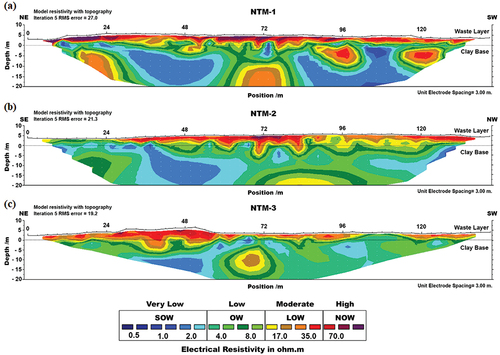
Figure 5. (a) Inverted EM results of the EC model, and (b) synthetic ER models obtained by inversion modeling of the conductivity data acquired from FDEM measurement along profiles NTM-1, NTM-2, and NTM-3. Adapted with permission from “Applying electromagnetic surveys as pre-screening tools prior to open dump mining,” by Boonsakul et al. (Citation2021), J mater cycles waste manag 23, 1518–1530. Copyright (2021) by Springer Japan KK, part of Springer nature.
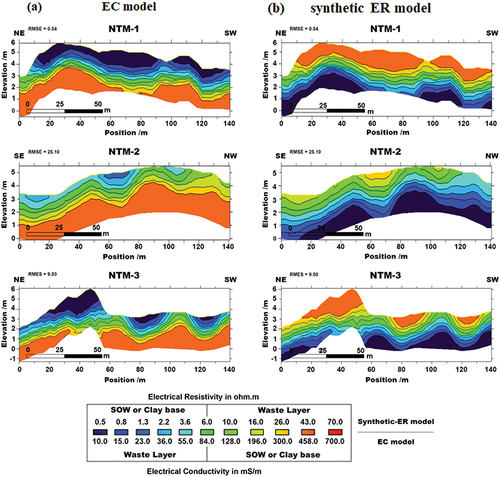
Figure 6. Comparing the effective frequency sets of all profiles.
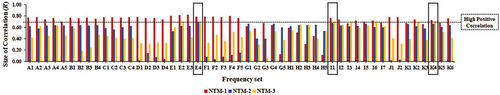
Figure 7. Distribution of ER data and synthetic ER data from (a) direct correlation analysis, (b) linear interpolation analysis, and (c) bilinear interpolation analysis.
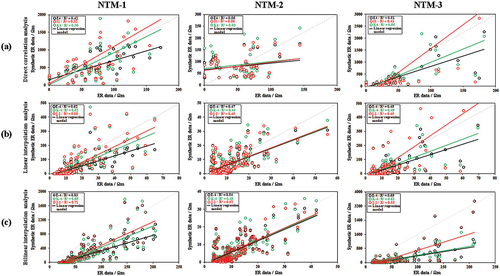
Figure 8. Comparison of the R values of the effective frequency sets E4, I1, and K4 in all three profiles.
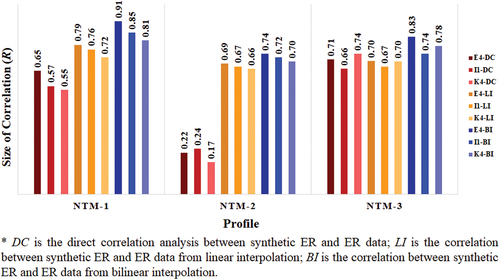
Table 2. Degree of RMSE value and the correlation (R) between the CSHCP standard values and the average CSHCP values for the effective frequency sets for each profile.
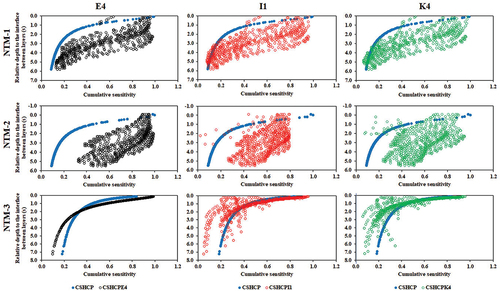
Figure 9. Validation and accuracy prediction results showing the correlation between standard CS and CS values of the E4, I1, and K4 effective frequency sets across all profiles.
Data availability statement
The data that support the findings of this study are available from the corresponding author, [KW], upon reasonable request.