
Figures & data
Figure 1. Illustration of the downwind road intersection point (DRIP). The red dot represents the center of an O&G facility pad and a location of a potential point emission source, α is the downwind direction at the source location relative to true north, D is the user-defined length of the line segment, and X is the DRIP. Wind is from the southwest to the northeast.
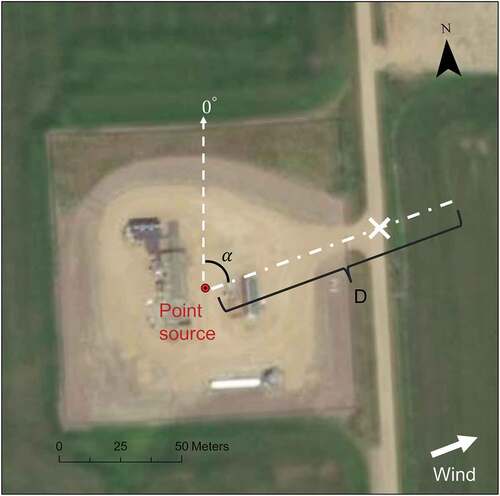
Figure 2. Flowchart of route planning with temporally- and spatially-varying forecast wind direction.
Figure 3. Overview of the validation methodology. (a) CH4 mixing ratio measurements along a road with the wind direction denoted by the small arrows. (b) After the plume is segmented, two wind wedges are extracted from the vehicle’s wind measurements to verify that a facility or well point is located within one or the other. (c) Once the DRIP is determined the road distance to the peak CH4 and plume midpoint are measured to determine spatial errors. (d) A line graph showing the CH4 mixing ratio vs distance where 0 m is the north end of the plume. The driving speed for this sample case is about 67 km/hour.
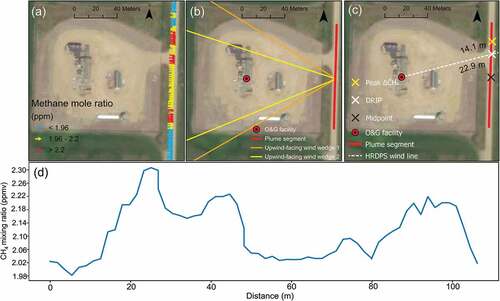
Figure 4. Operational demonstration of the methodology. The optimal route (green line) for 50 randomly selected oil and gas wells within 50 km of Pecos, Texas, USA, on 18 September 2021 is shown in panel (a). Panels (b-i) show the optimized routes for different time segments of the survey based on the estimated travel time. Wells are represented by colored points and labeled (A, B, C, …) according to the order they are surveyed in each segment. Subscript digits denote the corresponding time segment. Blue points are wells that were not surveyed because they did not have a DRIP located within 2 km downwind or their DRIPs were not included in the optimal route. Green points are wells that were surveyed because they had a DRIP located within 2 km downwind. Red points are wells surveyed in the specified survey segment. DRIPs are denoted by the red x’s. Black arrows are 2 km virtual lines calculated using the average of the two wind directions associated with the period displayed in the panel.
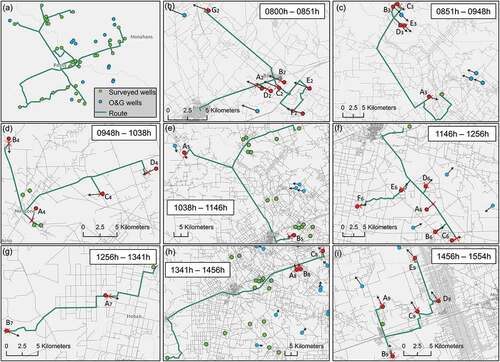
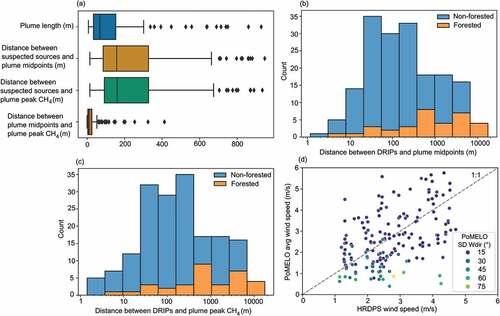
Figure 5. Validation results of DRIPs. (a) Box plots of plume lengths, the Euclidean distance between suspected sources and plume midpoints, the Euclidean distance between suspected sources and plume peak ΔCH4, and the Manhattan distance between plume midpoints and plume peak ΔCH4. (b) A histogram of the Manhattan distance between DRIPs and plume midpoints by landcover types (logarithmic scale). (c) A histogram of the Manhattan distance between DRIPs and plume peak ΔCH4 by landcover types (logarithmic scale). (d) A scatterplot between the HRDPS wind speed for each site and the average wind speed measured by PoMELO for each plume segment with colors indicate the standard deviation of wind directions measured by PoMELO.
Supplementary_Data.docx
Download MS Word (87 KB)Description_of_Supplementary_Data.docx
Download MS Word (12.3 KB)Data availability statement
The authors confirm that the data supporting the findings of this study are available within the article and its supplementary materials. Additional data are available by request.