
Figures & data
Figure 1. Schematic diagram of air flow direction.
Figure 2. Schematic diagram of community bins structure.
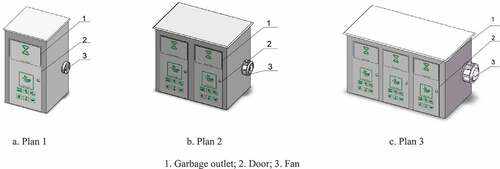
Table 1. Size of community bins and fan-pad systems.
Table 2. Cooling system parameters of community bins.
Table 3. Disposition scheme of community bins in residential area.
Table 4. The ratio of cost and water consumption of the three plans of community bins.
Table 5. Simulation parameters table.
Figure 3. Schematic diagram of model influencing factors.
Table 6. Test factors and levels.
Figure 4. Distribution of temperature measuring points.
Table 7. Schemes of experimental design.
Table 8. Results of ANOVA.
Figure 5. Response surface diagram of interaction between different factors.
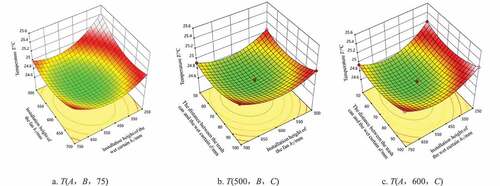
Figure 6. Temperature simulation value and error bar diagram of temperature measuring point.
Figure 7. Cloud map of temperature distribution on the front view surface of the trash cans.
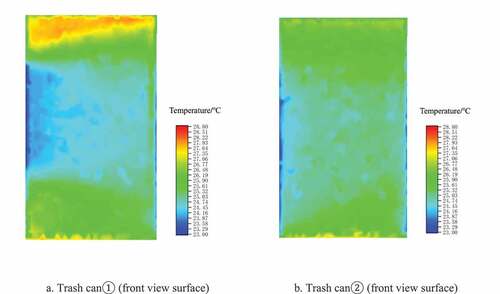
Figure 8. Cloud map of temperature distribution on the side view surface of the trash cans.
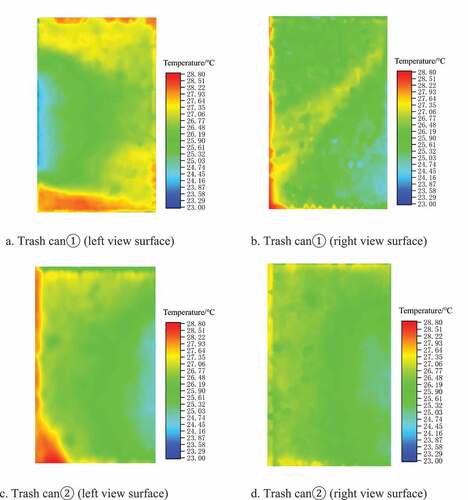
Figure 9. Test model and setup of community bin.
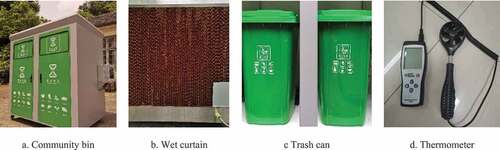
Figure 10. Temperature distribution and error bar diagram of temperature measuring points.
Data availability statement
The datasets generated during and/or analyzed during the current study are not publicly available due to privacy reasons, but are available from the corresponding author on reasonable request.