
Figures & data
Table 1. Specification of odor sensors used in this study.
Table 2. Information on three environmental treatment facilities and their odor treatment plants.
Figure 1. Customized environmental monitoring system including odor sensors to measure ammonia, hydrogen sulfide and TVOC.
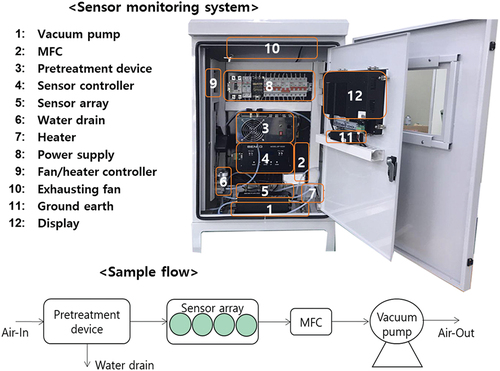
Table 3. Summary of performance tests for the three sensors used in this study (Han et al. Citation2019).
Figure 2. Sensor measurement data at a municipal wastewater treatment facility (black solid line: In-OTP, and brown dotted line: Out-OTP).
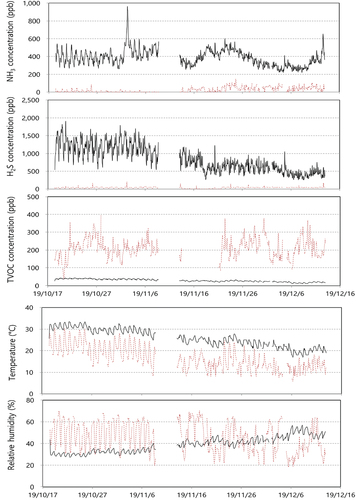
Table 4. Sensor monitoring data from a municipal wastewater treatment facility.
Figure 3. Sensor measurement data at a livestock wastewater treatment facility (black solid line: In-OTP, and brown dotted line: Out-OTP).
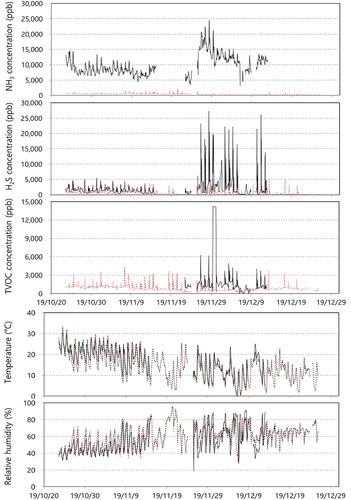
Table 5. Sensor monitoring data from a livestock wastewater treatment facility.
Figure 4. Sensor measurement data at a food waste composting facility (black solid line: In-OTP, and brown dotted line: Out-OTP).
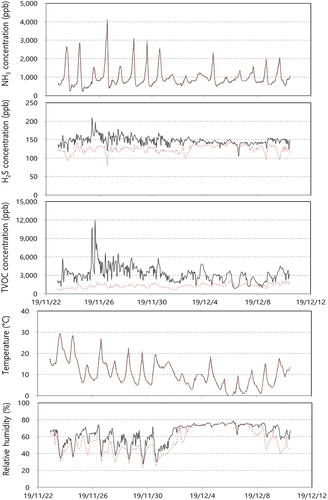
Table 6. Sensor monitoring data from a food waste composting facility.
Figure 5. Correlation between odor by ADOM and each sensor measurement concentrations of NH3 (black), H2S (brown), TVOC (blue) in MWT (a), LWT (b), FWC (c), respectively.
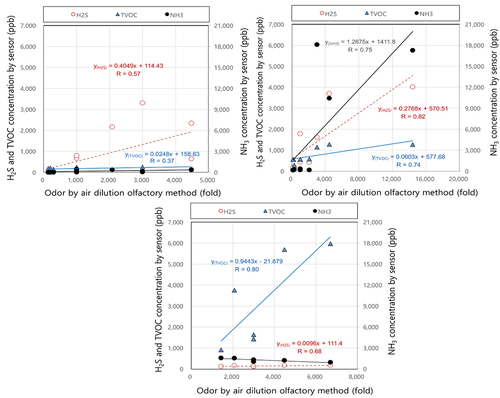
Table 7. Multivariate linear regression between complex odor (dependent variable) measured by ADOM and sensor measurement data.
Figure 6. Correlation comparison between odor by odor estimated by sensor data (a) and ADOM and odor divided by the odor threshold values (b) and (black: MWT, brown: LWT, blue: FWC).
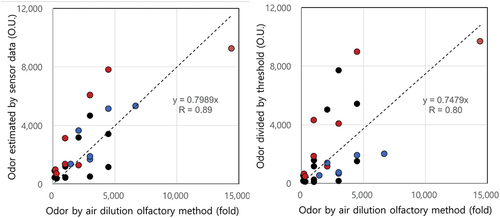
Figure 7. Correlation between odor estimated by correlation equation (eq.1) and odor divided by threshold (black: MWT, brown: LWT, blue: FWC).
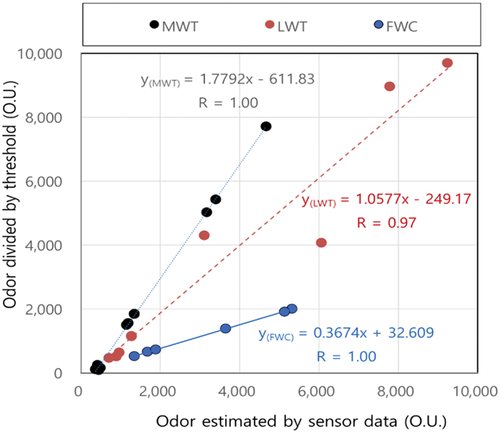
Figure 8. Estimated odor unit from sensor measurement data and removal efficiency at a MWT (a), LWT (b), FWC (c), respectively (black solid line: In-OTP, and brown dotted line: Out-OTP, blue solid line: removal efficiency).
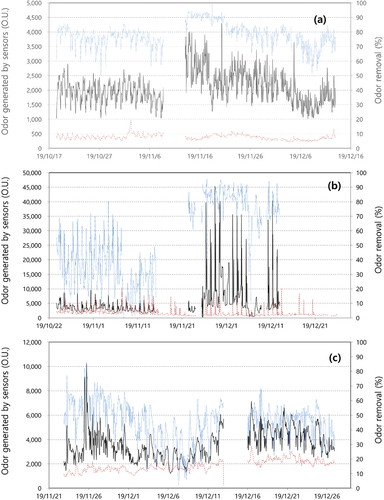
Table 8. Odor intensity generated by the linear regression using sensor measurement data.
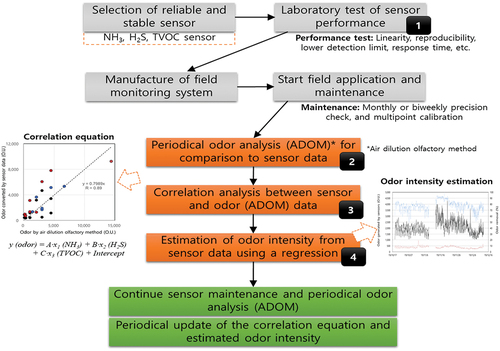
Figure 9. Suggested protocol for field application of sensor monitoring and odor data estimation.
Data availability statement
The data that support the findings of this study are available from the first author,[HSJ], corresponding author, [JSH], upon reasonable request.