
Figures & data
Figure 1. (a) the location of the test site is shown via the red pin (116.89°E, 39.64°N). The flight range in this study is shown in the inset, with a flight radius of 2 km; (b) the Xiangyu I UAV is equipped with a portable aerosol particle size spectrometer (GRIMM 1.109), and an isokinetic sampling device is designed based on the flight speed of the aircraft. It uses a catapult when taking off, and rolling/parachuting when landing.
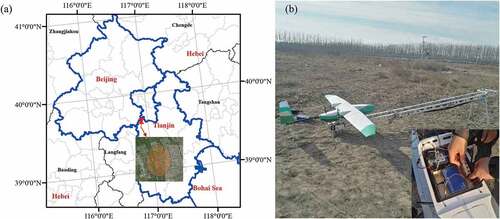
Figure 2. (a) PM concentrations and (b) AQI in Tianjin from January 3, 2017 to January 11, 2017. Data were obtained from the national urban air quality report released by the China environmental monitoring center. Flight 1 is under the Severe polluted condition (Aqi>300), and other flight are under the Excellent condition (Aqi<50).
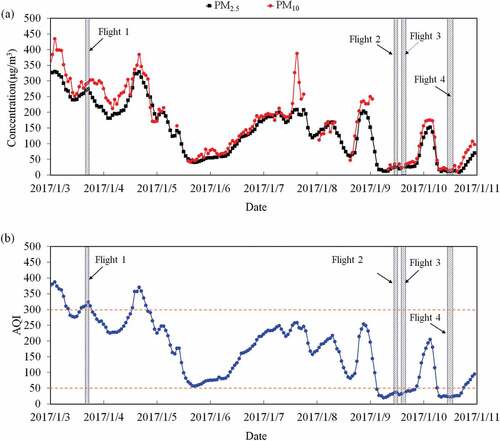
Table 1. Information about the flight test and air quality of Tianjin in the same period.
Figure 3. Flight trajectory and PM2.5 mass concentration on each flight, with an altitude range of 11–920 m. Flight 1 is under the Severe polluted condition; other flight are under the Excellent condition. (a) Flight 1; (b) Flight 2; (c) Flight 3; (d) Flight 4; (e) Average concentration of PM2.5.
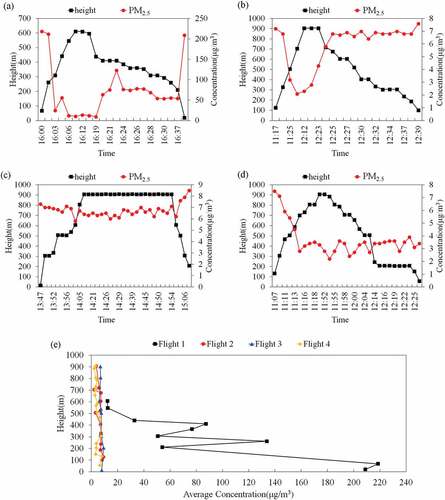
Figure 4. Changes in PM concentrations and meteorological factors with altitude. Flight 1 is under the Severe polluted condition; the other flight are under the Excellent condition. (a) PM1, PM2.5, and PM10 concentrations on each flight; (b) Simulated temperature and relative humidity on each flight.
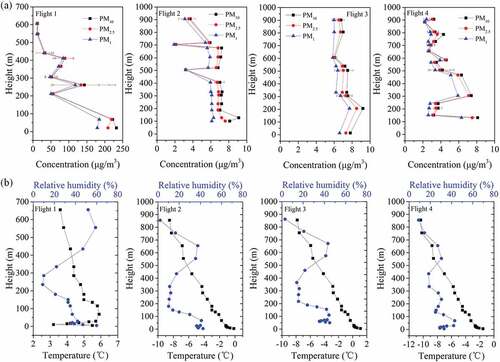
Figure 5. Changes in wind speed, wind direction, and temperature with time and altitude during the flight test. Data of 16:00 on January 3 is for Flight 1. Data of 11:00–13:00 on January 9 is for Flight 2. Data of 13:00–15:00 on January 9 is for Flight 3. Data of 11:00–12:00 on January 10 is for Flight 4.
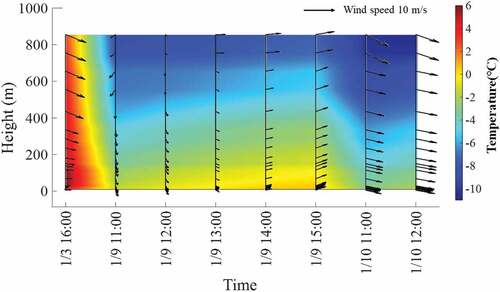
Table 2. Pearson correlation coefficients between PM concentrations and meteorological factors.
Figure 6. Particle mass concentration with altitude, which is divided into small particles (Dp <1 μm) and large particles (Dp> 1 μm). Flight 1 is under the Severe polluted condition; the other flights are under the Excellent condition. (a) Flight 1; (b) Flight 2; (c) Flight 3; (d) Flight 4.
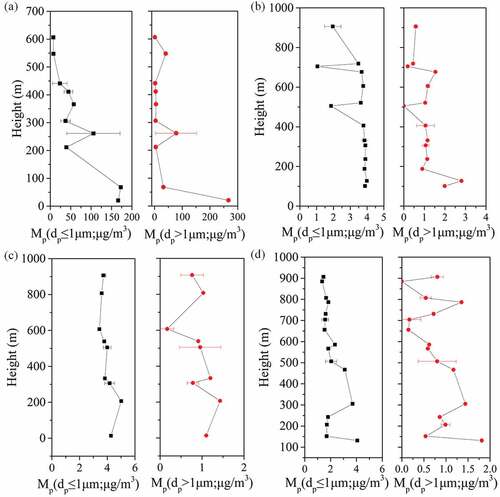
Figure 7. Vertical distribution of mass concentration spectrum of each flight. Flight 1 is under the Severe polluted condition; the other flights are under the Excellent condition. (a) Flight 1; (b) Flight 2; (c) Flight 3; (d) Flight 4.
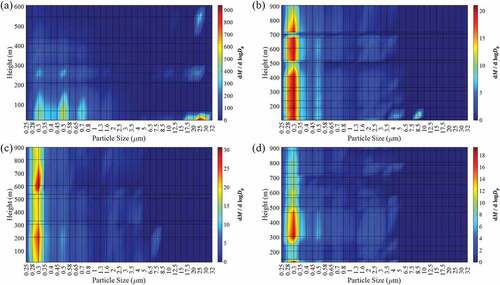
Figure 8. Particle number variation with altitude that is divided into small particles (Dp <1 μm) and large particles (Dp> 1 μm). Flight 1 is under Severe polluted condition, and other flight are under excellent condition. (a) Flight 1; (b) Flight 2; (c) Flight 3; (d) Flight 4.
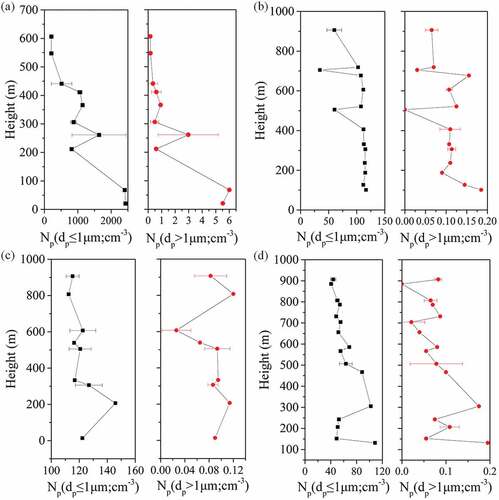
Figure 9. Vertical distribution of number concentration spectrum of each flight. Flight 1 is under the Severe polluted condition; the other flights are under the Excellent condition. (a) Flight 1; (b) Flight 2; (c) Flight 3; (d) Flight 4.
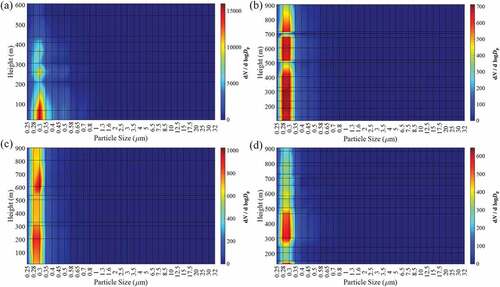
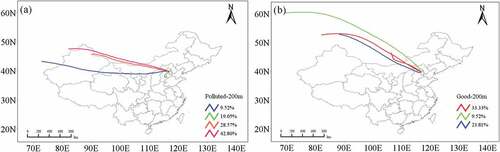
Figure 10. Backward trajectory clusters at the test site. The observation data are based on the State-controlled station in Tianjin, and the test site (116.89°E, 39.64°N) is used as the simulation starting point. The 48 h backward trajectory of the measurement point is calculated. The simulation altitude is 200 m. (a) Severe polluted condition; (b) Excellent condition.
Data availability statement
The data that support the findings of this study are available from the corresponding author, upon reasonable request.