
Figures & data
Figure 1. Hazardous waste.
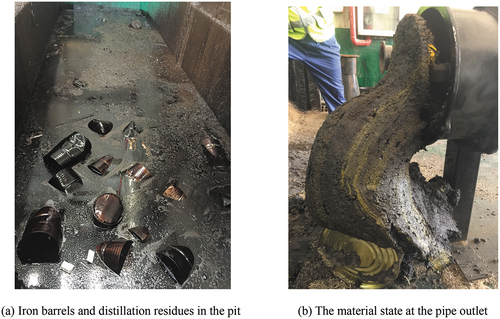
Figure 2. Distillation residues and sludge.
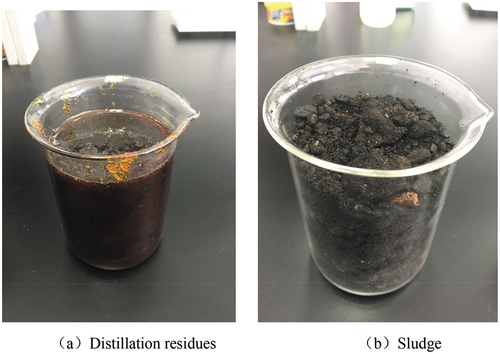
Table 1. Calorific value and chemical element test results.
Figure 3. Slump detection.
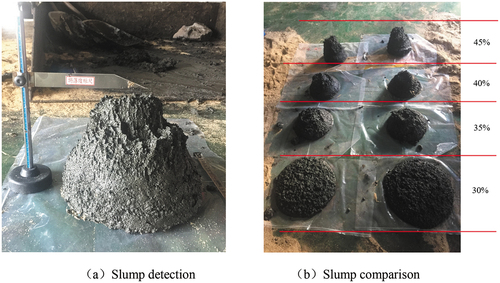
Table 2. Slump results.
Figure 4. Spray gun dispersion characteristic test system.
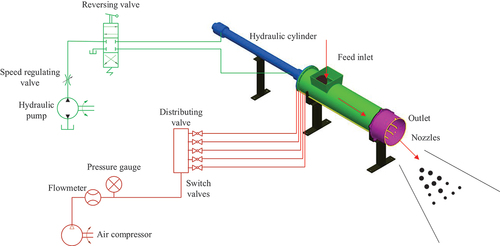
Figure 5. Structure of spray gun outlet.
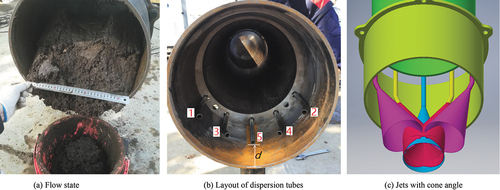
Table 3. Parameters of orthogonal experiment.
Figure 6. V-shape experimental site.
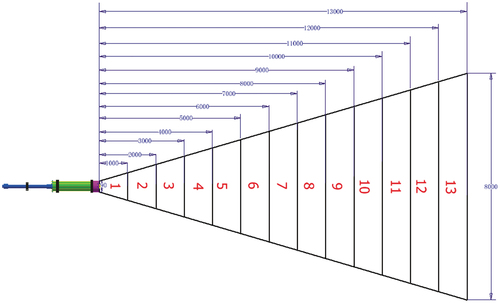
Figure 7. The actual area distribution.
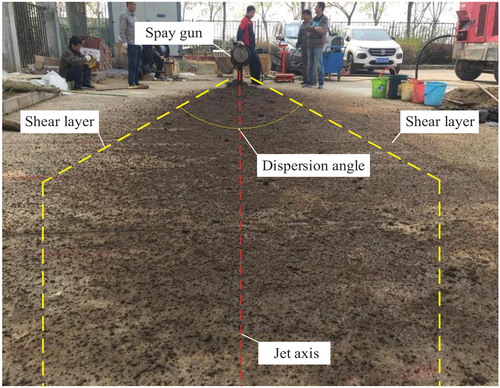
Figure 8. Areas distribution with different nozzle systems at the same distance and pushing speed.
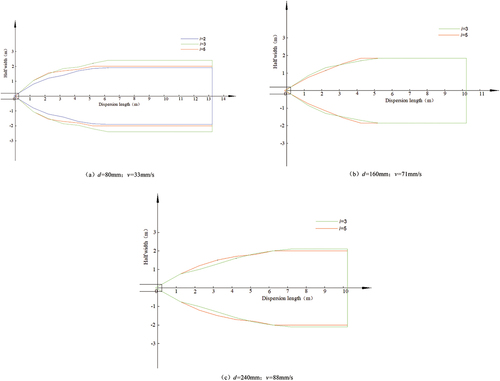
Figure 9. Parameter variation of free turbulent jet.
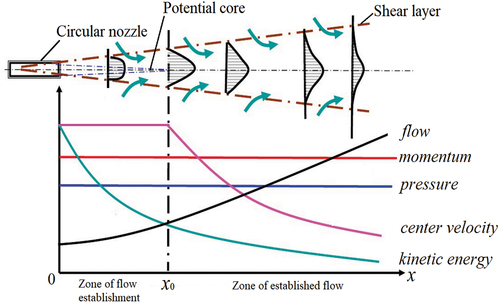
Figure 10. Areas distribution with different distances at i = 3 and v = 71 mm/s.
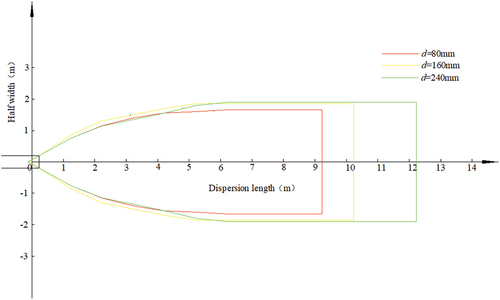
Figure 11. Gas jets at i = 3.
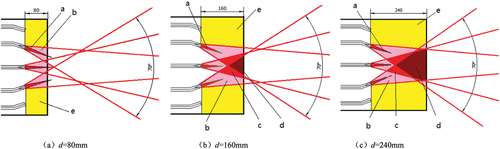
Figure 12. Area distribution with different speeds at i = 3 and d = 80 mm.
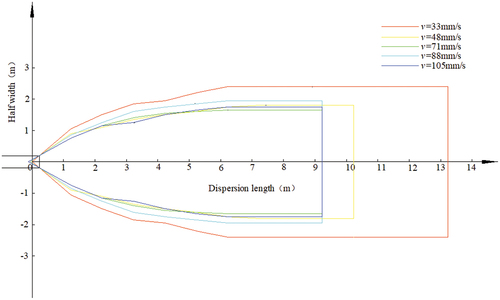
Figure 13. Particle size at d = 80 mm, i = 2, v = 105 mm/s.
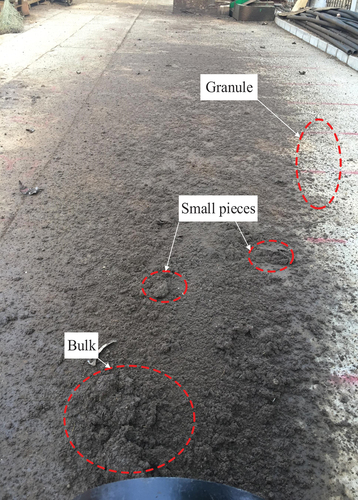
Figure 14. Mass distribution with different nozzle systems.
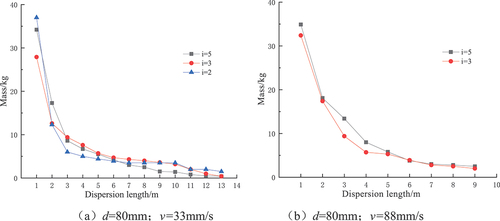
Figure 15. Mass distribution with different nozzle systems.
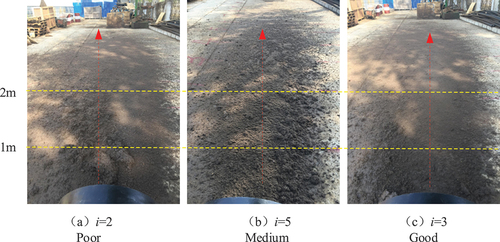
Figure 16. Particle distribution.
Figure 17. Mass distribution at different distances.
Figure 18. Mass distribution at different pushing speeds.
Figure 19. Area density distribution at different speeds.
3.0dispersion_characteristic.avi
Download Microsoft Video (AVI) (14.3 MB)Data availability statement
The data that support the findings of this study are available from the corresponding author upon reasonable request.