Figures & data
Figure 1. Metropolitan Melbourne. (a) local government area (LGA) borders, location of monitoring sites and weather station used in analysis; (b) population density; (c) elevation; (d) industrial zoned areas (orange) and major roads (freeways, highways, and arterial roads; gray lines).
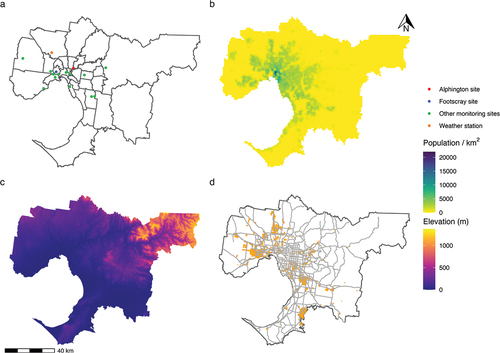
Table 1. Summary of original and imputed hourly pollutant measurements for the Alphington and Footscray monitoring sites, 2014–2019.
Table 2. Summary of original and imputed hourly meteorological measurements for the Melbourne airport weather station, 2014–2019.
Table 3. Recorded emergency department presentations and hospital admissions for acute upper respiratory infection (AURI), acute lower respiratory infection (ALRI), and asthma or chronic obstructive pulmonary disease (COPD), for residents of metropolitan Melbourne 2014–2019, by age.
Figure 2. Incidence rate ratios for the estimated short-term effects of for a 10 µg/m3 increase in ambient PM2.5 concentration on emergency department (ED) presentations and hospital admissions for acute respiratory illnesses. Lags refer to the number of days from exposure/covariate measurement to outcome. Lag “Days 0-6” refers to the effect of exposures averaged across days 0–6 prior to outcome measurement. AURI: acute upper respiratory infection, ALRI: acute lower respiratory infection, COPD: chronic obstructive pulmonary disease. Vertical lines represent 95% confidence intervals.
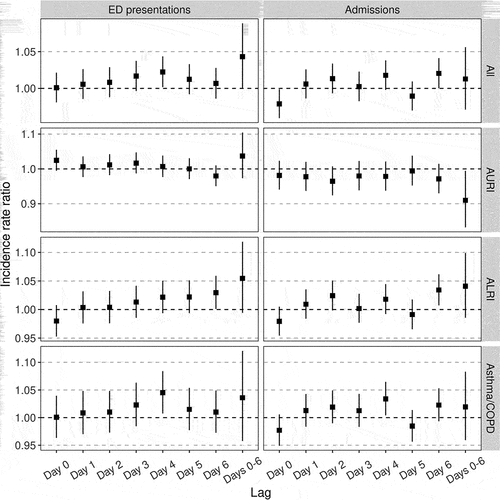
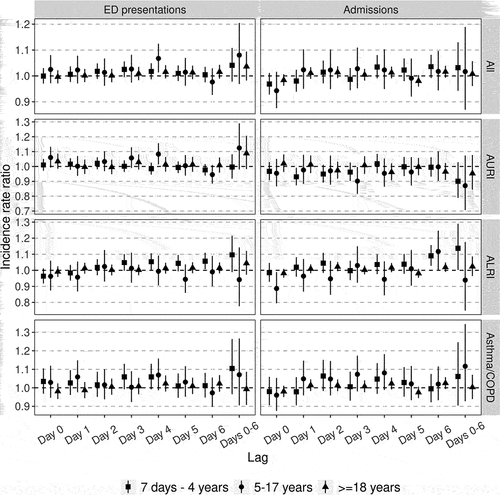
Figure 3. Incidence rate ratios for the estimated short-term effects of for a 10 µg/m3 increase in ambient PM2.5 concentration on emergency department (ED) presentations and hospital admissions for acute respiratory illnesses by age group. Lags refer to the number of days from exposure/covariate measurement to outcome. Lag “Days 0-6” refers to the effect of exposures averaged across days 0–6 prior to outcome measurement. AURI: acute upper respiratory infection, ALRI: acute lower respiratory infection, COPD: chronic obstructive pulmonary disease. Vertical lines represent 95% confidence intervals.