
Figures & data
Table 1. Summary of data sources obtained in this research for biomass boiler combustion as compared to AP-42 for wood residue combustion. Timeframe refers to the time when the data were collected, not the years in which the boiler was set up.
Figure 1. Summary of emission factors for aerosol, gaseous, and hazardous air pollutants from stack testing data.
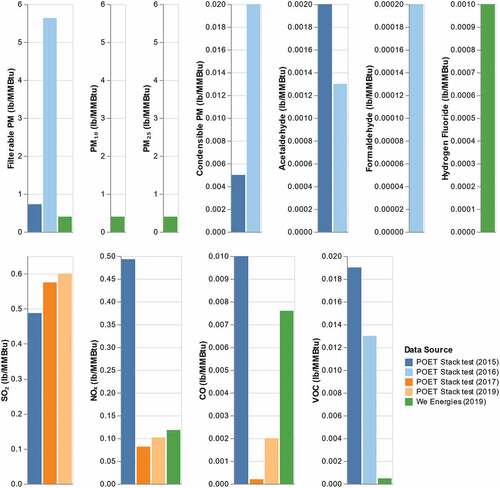
Table 2. Summary of operating information from stack test data sources.
Figure 2. Emission factors used for air permits and air permit applications for selected pollutants.
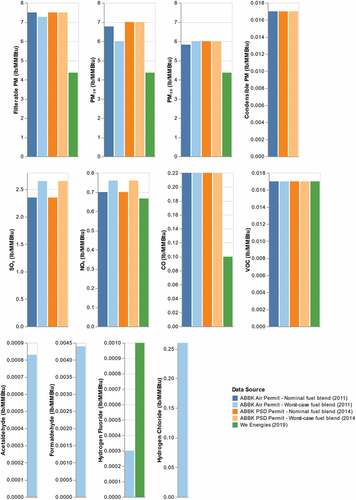
Table 3. Summary of operating information from air permit data sources.
Figure 3. Emission factors for selected pollutants based on the data reported in NCASI technical bulletins. Data for “MACT testing” and the “pulp and paper” do not indicate feed type because these emission factors are based on data from several boilers where the feed composition is not uniform.
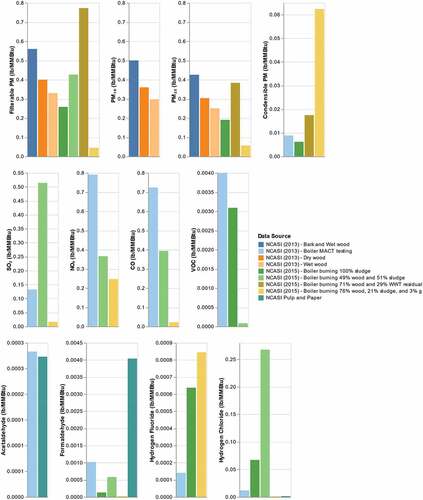
Figure 4. Emission factors for PM10, PM2.5, selected HAPs, and gaseous pollutants that are calculated from data reported by CORRIM. Y-axis units are lb/MMBtu. The data sources refer to 12 individual wood mills (wood production facilities) surveyed by CORRIM in the Pacific Northwest and Southeast United States. (Note that details about individual mills are not available since these were considered business confidential information.)
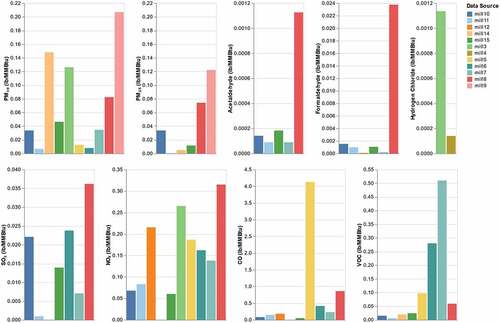
Figure 5. Distribution of biomass-fueled boiler emission factors from collected data sources for each pollutant and inclusive of all fuels. Whiskers correspond to 5th and 95th percentiles, with means shown as black squares, medians as horizontal lines, and emission factors from EPA’s AP-42 as red dots. The number of data points used for each pollutant are also shown (n). These box plots report uncontrolled emission factors and thus do not include the CORRIM data.
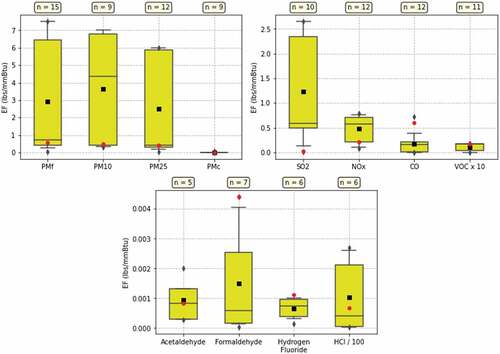
Table 4. Range and median emission factors (lb/MMBtu) from data sources collected herein including air permits, stack test data, and industry research reports as compared to EPA’s AP-42 values, disaggregated by fuel type.
Boiler_emission_factor_data_Supplementary_Information.docx
Download MS Word (58.6 KB)Data availability statement
The authors confirm that the data supporting the findings of this study are available within the article and its supplementary materials.