
Figures & data
Table 1. Scope of material analysis of bio-waste.
Figure 1. Monthly changes in the amount of separately collected bio-waste in urban and rural areas between November 2021 and April 2022.
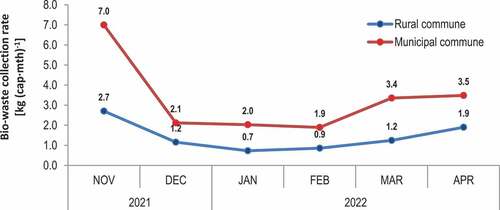
Figure 2. Share of garden waste, food waste, contaminants and bags for separate collection (bin bags) in bio-waste from households, urban single-family (A) and multi-family housing (B) and rural municipalities (C).
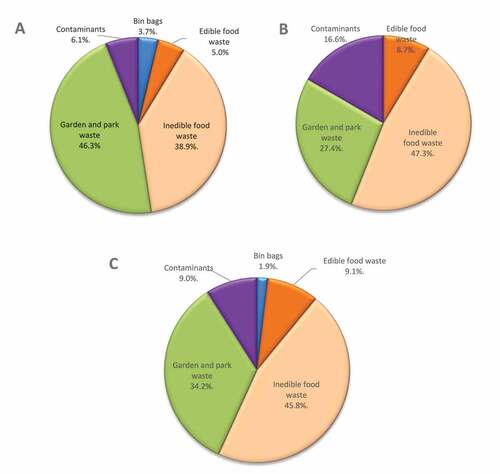
Table 2. Breakdown of the food waste fractionate occurring in separately collected bio-waste from households, urban single-family and multi-family housing and rural areas.
Figure 3. Changes in the shares of garden waste, edible and non-edible food waste, contaminants and selective collection bags in household bio-waste from urban single-family and multi-family housing and from rural municipalities.
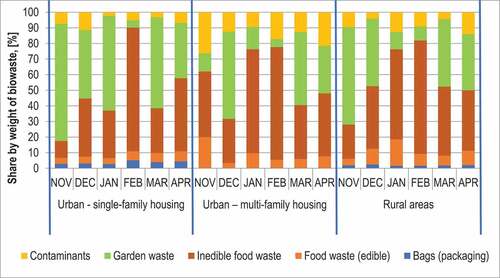
Figure 4. Composition and contaminant content of household bio-waste collected from single-family (US) and multi-family (UM) developments in urban and rural municipalities (R).
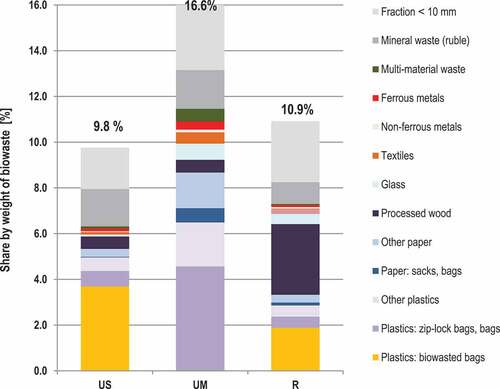
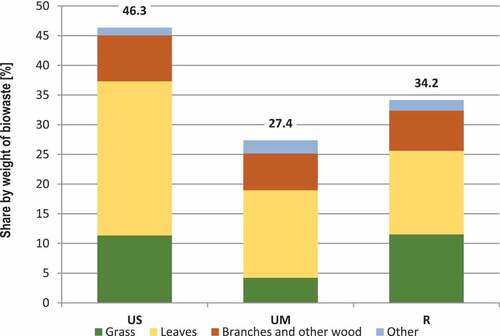
Figure 5. Types and average content of garden waste components in household bio-waste collected from single-family (US) and multi-family (UM) developments in urban and rural municipalities (R) in the period November to April.
Data availability statement
The data that support the findings of this study are available from the corresponding author, [WD], upon reasonable request.