
Figures & data
Figure 1. Location of DoD installations that are part of the DoD VI database of commercial and industrial buildings.
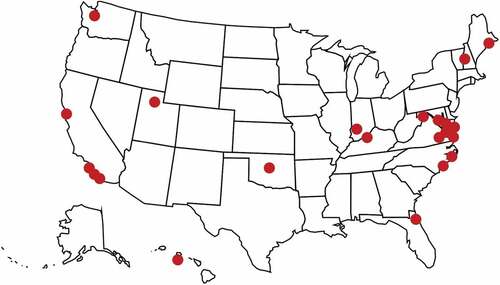
Table 1. Selected VOC background levels in indoor air and resulting source strength screens for groundwater vapor data.
Figure 2. Procedure for screening indoor air-groundwater data pairs.
Figure 3. Plot of indoor air-groundwater data pairs for the VOCs included in the analysis. Each data point represents the average indoor air and maximum measured groundwater concentrations for a given sampling event for a building sampling zone. Only pairs that passed the baseline, atypical preferential pathway, and source strength screening steps are included. The source strength screens for each VOC are shown in . There were no pairs meeting the various screening criteria for 1,1,1-TCA and 1,1-DCE (Table S1). Pairs with an indoor air concentration below detection limit are not shown. The two blue oblique lines represent the groundwater AF lines 10−4 and 1.0. The green line represents the EPA default groundwater AF of 10−3. Also shown is the linear best fit and associated equation, with “IA” and “GW” representing the indoor air and groundwater vapor concentrations, respectively.
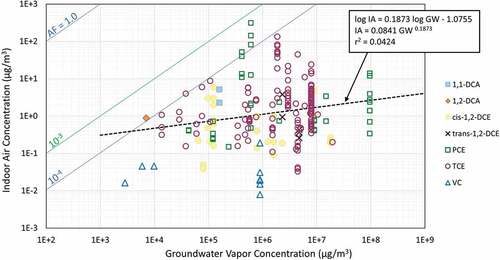
Figure 4. Box-and-whisker plots summarizing groundwater AF distributions. N indicates the number of indoor air-groundwater data pairs remaining after applying the baseline, atypical preferential pathway, and source strength screening steps. Pairs with an indoor air concentration below detection limit are not included.
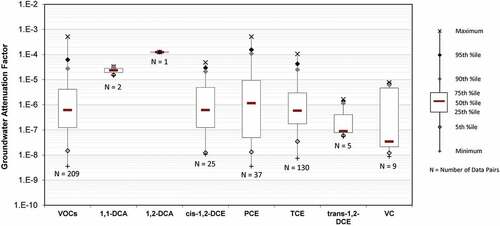
Figure 5. Box-and-whisker plots summarizing groundwater AF distributions associated with selected VOCs. Comparison between distributions obtained using indoor air (IA) detects only and IA non-detects (ND) taken at detection limit (DL). N indicates the number of indoor air-groundwater data pairs remaining after applying the baseline, atypical preferential pathway, and source strength screening steps.
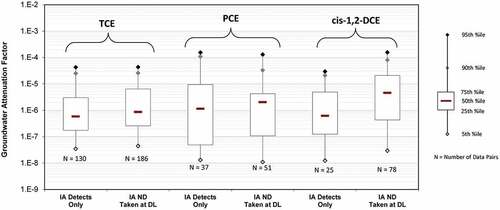
Figure 6. Box-and-whisker plots summarizing groundwater AF distributions associated with TCE, PCE, and cis-1,2-DCE. Comparison between AF distributions derived from building sampling zone averages for individual sampling events (“per event”) and from building sampling zone averages for all sampling events (“all events”). N indicates the number of indoor air-groundwater data pairs remaining after applying the screening and averaging steps. Pairs with an indoor air concentration below detection limit are not included.
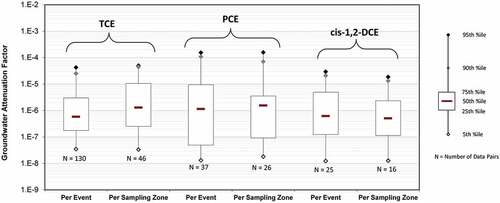
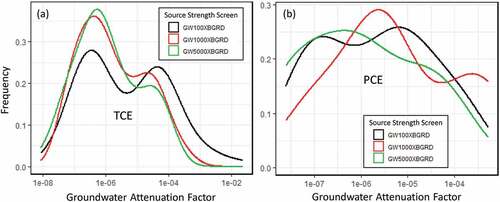
Figure 7. Groundwater AF frequency distribution plots for TCE (a) and PCE (b) after application of several source strength screens ranging from 100 to 5,000 times the background reference levels for TCE (2.1 µg/m3) and PCE (8.0 µg/m3), respectively.
GW_AF_Paper-Electronic_Supplementary_Information.docx
Download MS Word (35.2 KB)Data availability statement
The data that support the findings of this study are available from the corresponding author, LCL, upon reasonable request.