
Figures & data
Figure 1. String Reactor diagram with sketch of sampling apparatus and insert of pulling mechanism (not to scale). Insulation shown on the middle port only for illustration but is present on all exposed quartz.
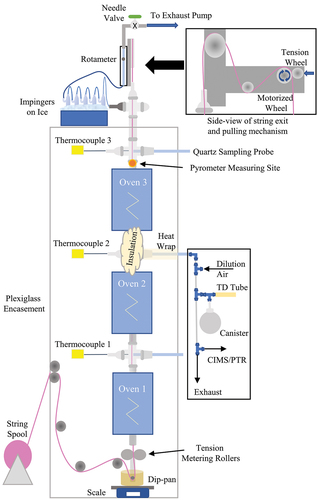
Table 1. Fabric coating simulator settings for static experiments (constant settings) and dynamic experiments (varying furnace 3 fiber exit temperature).a
Table 2. Canister GC-MS data for static Water-Tergitol-6:2 FTOH experiments (ppbv).a,b
Table 3. Fluorinated compounds detected in thermal desporption (TD) tube samples (static experiments).a
Figure 2. Mass defect visualizations of CIMS data from each port during PFAS-free H2O (left column), H2O + Tergitol (center column), and H2O + Tergitol+6:2 FTOH (right column).
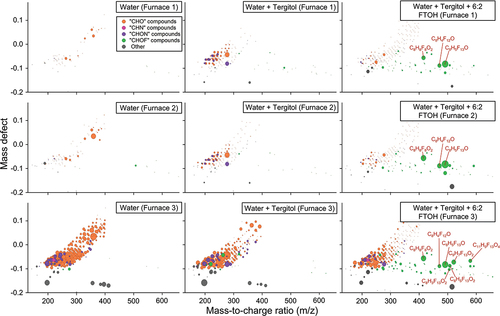
Figure 3. CIMS measurements from the Water + Tergitol + 6:2 FTOH experiment.
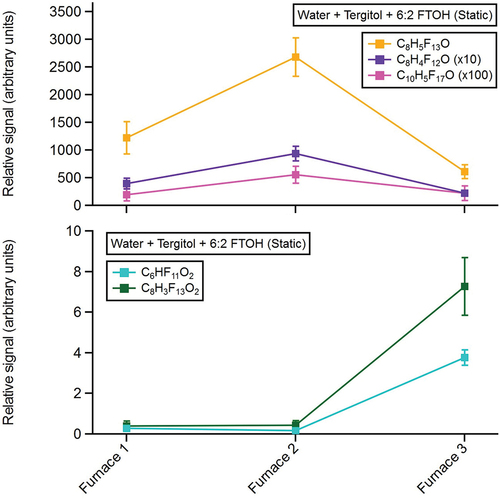
Table 4. Canister GC-MS data for static dispersion experiments (ppbv).a,b,c
Table 5. Calculated emission factors (EF).a
Figure 4. Recorded temperatures from temperature ramp experiments for (A) Water + Tergitol + 6:2 FTOH and (B) FEPD 121. Black text on graphs represents temperature setpoints of the temperature controller in degrees Celsius. Note: String broke during 721°C setpoints as indicated by gray box and “S.B.”.
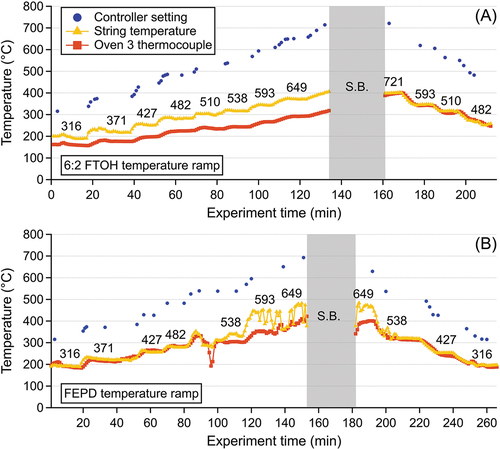
Figure 5. CIMS measurements from the Water + Tergitol + 6:2 FTOH temperature ramp.
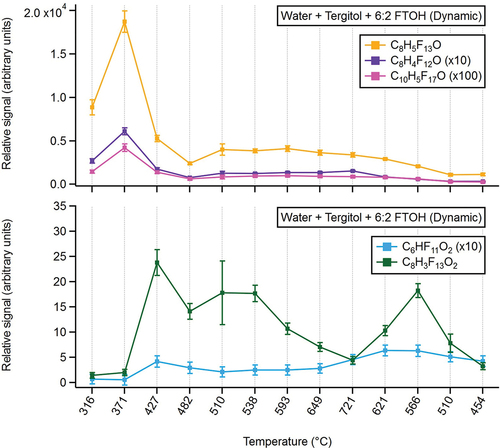
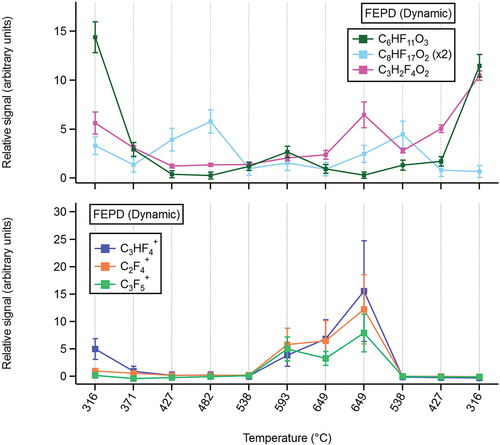
Figure 6. CIMS (top panel) and PTR-MS (bottom panel) measurements from FEPD 121 temperature ramp experiment.
Rev-SI_PFAS_Air_Emissions_from_Fabric_Coating_20230213_final.docx
Download MS Word (2.7 MB)Data availability statement
The data that support the findings of this study are openly available on ScienceHub at http://doi.org/10.23719/1527849 reference number D-g4fk.