
Figures & data
Figure 1. The destruction profile for 8:2 FTOH with thermal treatment only and the disappearance of a fluorinated PID observed with the catalyst. The catalyst points are based on the peak area of a PID formed by 250°C that replaces the FTOH in the chromatograms.
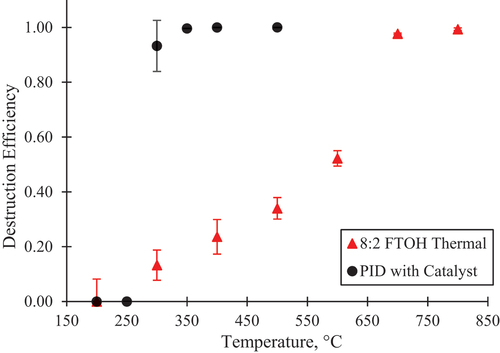
Figure 2. The thermal only destruction profiles for the molecules in the NEt-FOSE experiment. NEt-FOSA and PFOSA were present as adulterants in the standard and were not separately tested. The NEt-FOSA and PFOSA points at 200°C are overlaid with the NEt-FOSE data point. At 500°C, NEt-FOSE and PFOSA were fully destroyed and only NEt-FOSA was detected. With the catalyst, the parent molecules were no longer present.
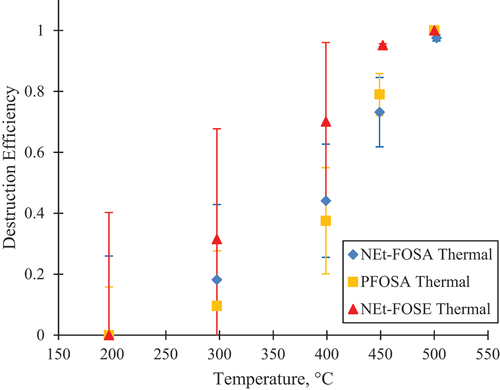
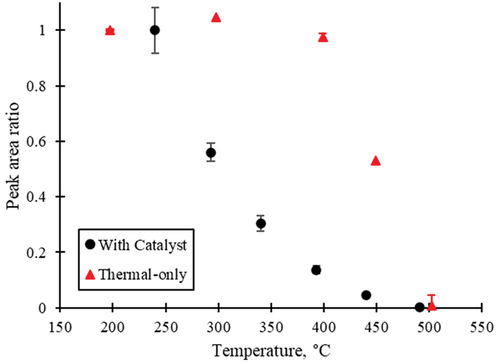
Figure 3. The thermal-only and catalytic profiles for the PID observed during both treatments of NEt-FOSE. The peak ratio between the largest peak area and the area at the given temperature is shown. The PID had a retention time of 18.97 min and m/z of 541.00109. With catalyst treatment, the PID’s peak area decreases at lower temperatures compared to thermal-only treatment.
Revised-SI-LowTempDestructionGasPhasePFAS.docx
Download MS Word (2.7 MB)Data availability statement
The data that support the findings of this study are available at https://doi.org/10.23719/1527784.