
Figures & data
Figure 1. The five regions were surveyed during this study. The numbers by the region indicate the total number of landfills and the response rate of that region. Nine landfills did not provide their locations.
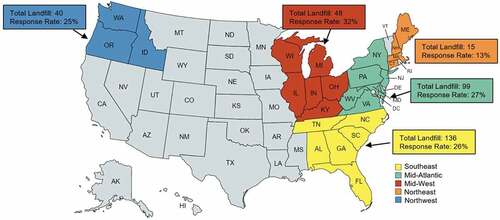
Figure 2. The logical flow of the survey on the current leachate treatments of public municipal solid waste landfills and the potential PFAS impact in the Eastern and Northwestern United States.
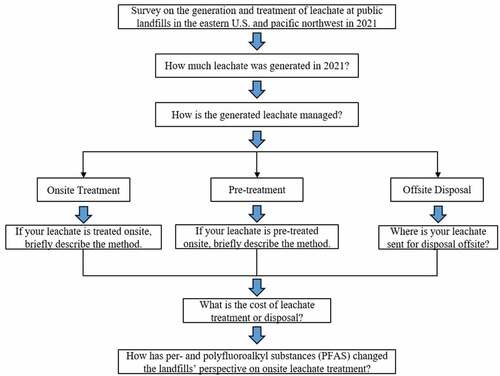
Figure 3. The leachate generated per ton of waste from the landfills in the five regions in the year 2021.
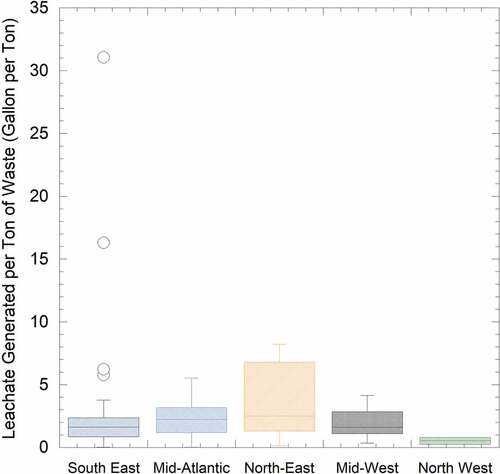
Figure 4. The current leachate treatment methods responded by the public-owned landfills.
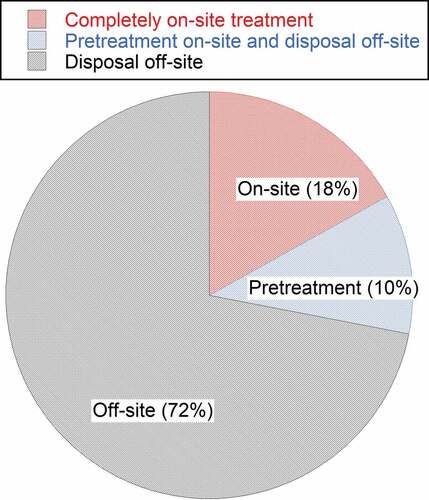
Figure 5. The breakdown of onsite treatment technologies reported by the public-owned landfills.
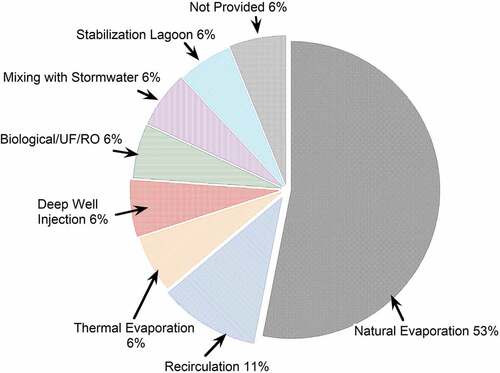
Figure 6. Cost per gallon for each onsite application compared with data in SWANA (Citation2014).
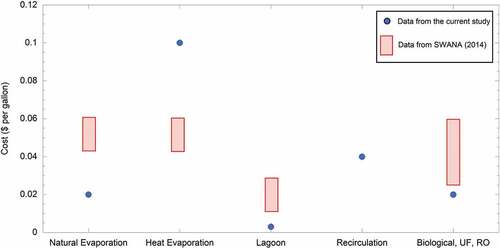
Table 1. The breakdown of pre-treatment technologies and the associated cost.
Figure 7. Transportation and disposal costs for off-site treatment provided by this study.
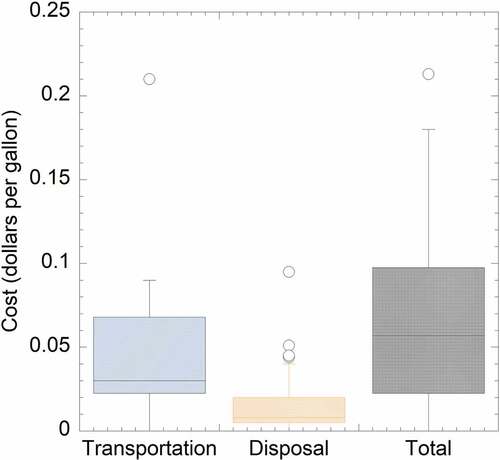
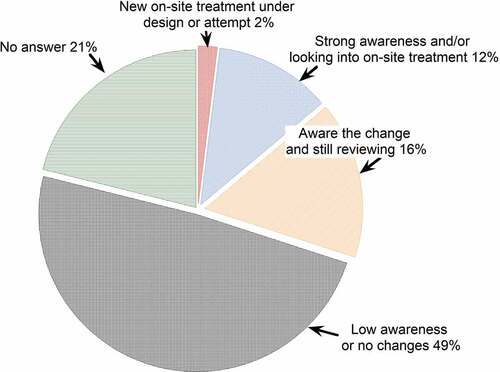
Figure 8. The responses from landfill managers on the potential PFASs impact on the landfill leachate treatment.
Data availability statement
The data that support the findings of this study are available on request from the corresponding author [JC]. The data are not publicly available since it contains information that could compromise the privacy of research participants.