
Figures & data
Figure 1. Cyprus map showing the locations of the studied districts (Nicosia, Limassol, Larnaka, Pafos, and Ammochostos).
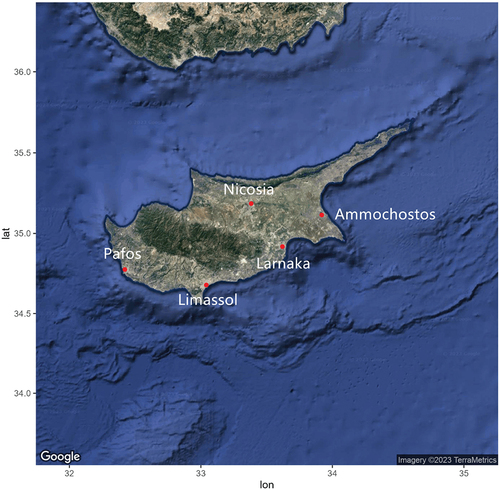
Table 1. Descriptive statistics of daily mortality, meteorological and air pollution data for the period from 1 January 2004 to 31 December 2019 in Cyprus.
Figure 2. Relative risk of temperature on mortality over a cumulative 14-day lag across Cyprus adjusting for time trend, seasonality, relative humidity, PM10, and day of the week (the shaded regions represent 95% CI).
Table 2. Overall relative risks for a cumulative distributive lag of 14 days for different heat and cold effects definitions in five districts of Cyprus, adjusting for time trend, seasonality, relative humidity, PM10, and day of the week (statistically significant results are marked with asterisks).
Figure 3. Meta-analysis pooled estimated effects of temperature on mortality over a 14-day lag for Cyprus (the shaded regions represent 95% CI, and the blue and red lines show cold and heat effects, respectively). The dashed lines represent the 99th and 1st percentiles. The dotted line represents the estimated minimum mortality temperature for the pooled relationship.
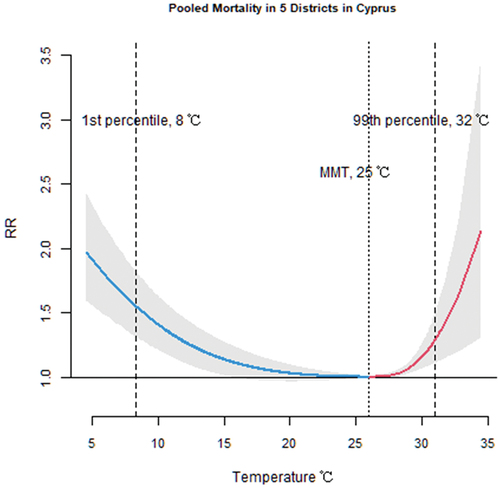
Table 3. Excess mortality attributed to heat and cold effects in Cyprus.