
Figures & data
Figure 1. Standardized test scores, by typology of answers, by test version (with or without pre-populated answers).
Notes: (i) Error bars represent the 95-percent point-wise confidence interval. (ii) Estimates from the linear regression model that underlies the figure are reported in Appendix B, .
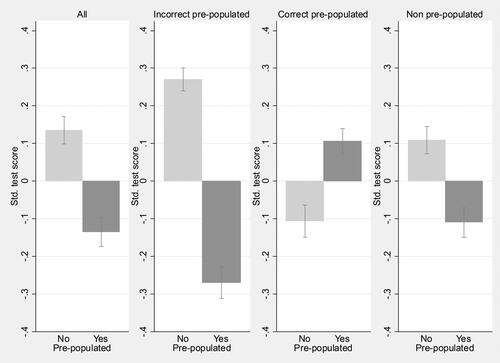
Figure 2. Standardized scores on the full test, by type of reminder.
Notes: (i) Error bars represent the 95-percent point-wise confidence interval. (ii) Estimates from the linear regression model that underlies the figure are reported in Appendix B, .
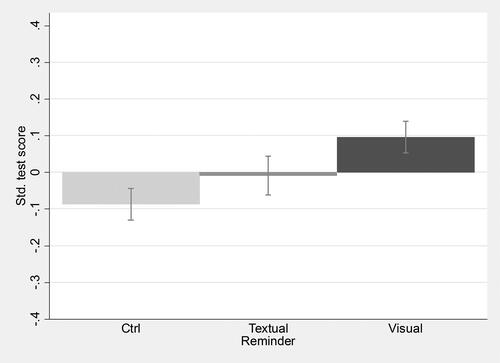
Figure 3. Interaction between defaults and reminders on the standardized score on the test, by typology of answer.
Note: Estimates from the linear regression model that underlies the figure are reported in Appendix B, .
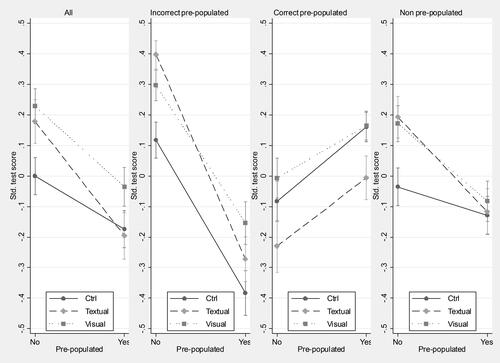
Figure A1. Scenario in the no default (i.e. no pre-populated) treatment.
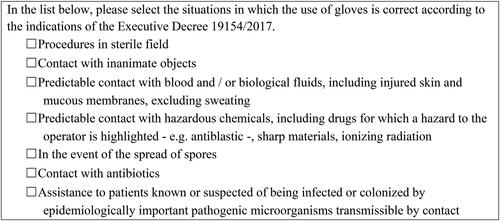
Figure A2. Scenario in the default (i.e. pre-populated) treatment.
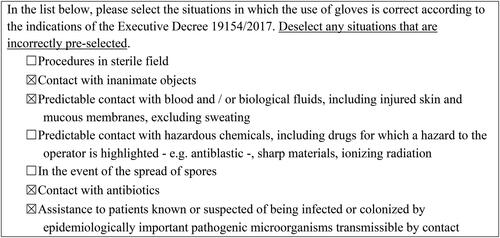
Figure A3. Scenario in the no reminder treatment.
Figure A4. Scenario in the textual reminder treatment.
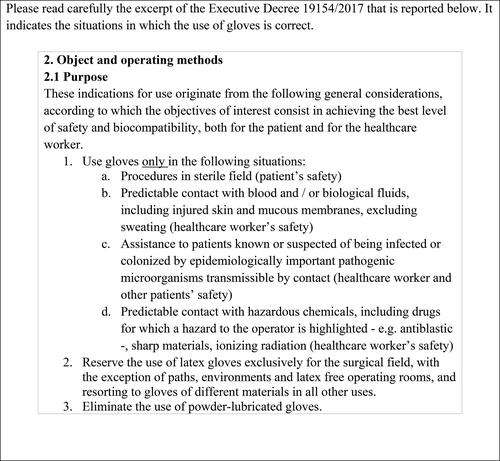
Figure A5. Scenario in the visual reminder treatment.
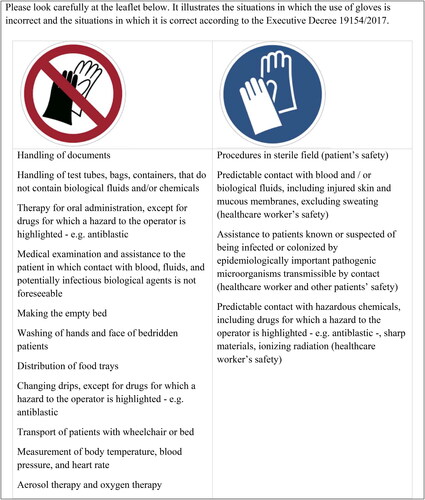
Table B1. Average unstandardized scores with standard deviations in parenthesis, by type of answers, by experimental arm.
Table B2. Results of a linear regression model estimating the average standardized score as a function of default treatments, by type of answers.
Table B3. Results of a linear regression model estimating the average standardized score on the full test as a function of reminder treatments.
Table B4. Results of a linear regression model estimating the interaction between defaults and reminders on standardized score on test, by type of answers.