
Figures & data
Figure 1. Theoretical model.
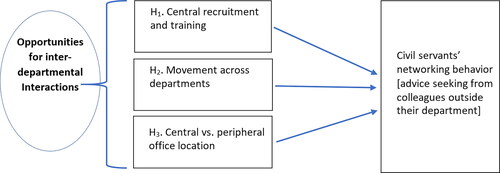
Table 1. Variables operationalization.
Table 2. Descriptive statistics.
Table 3. Linear mixed-effect model: frequency of inter-departmental advice seeking.
Figure 2. Respondents’ frequency of advice seeking with a composite index (1–6).
Notes: regressions predictions from an equivalent to model 5 of run with a composite index of the frequency of advice seeking.
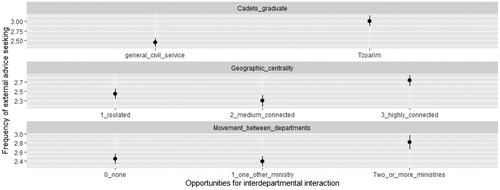
Table 4. Linear mixed-effect model: number of external advisors (1–10).
Supplemental material