Figures & data
Figure 1. FDI inflow of major sectors since the late 1990s (unit: billion USD).
Data source: CHINA STATISTICAL YEARBOOK, National Bureau of Statistics of China
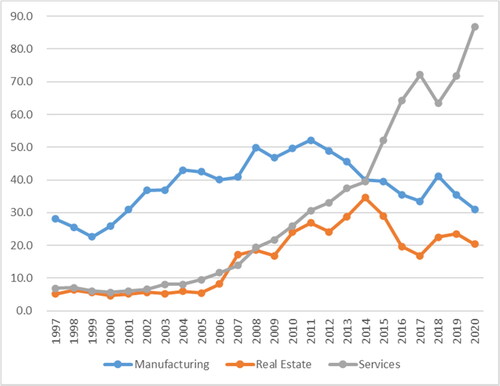
Figure 2. FDI proportion of major sectors in the annual total (unit: 100%).
Data source: CHINA STATISTICAL YEARBOOK, National Bureau of Statistics of China
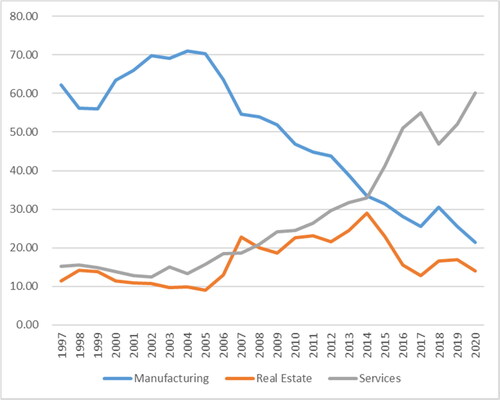
Figure 3. FDI stock by the three sectors in values over 1997-2020 (unit: billion USD).
Data source: CHINA STATISTICAL YEARBOOK, National Bureau of Statistics of China
Note: The agriculture (primary) sector includes planting, forestry, animal husbandry and fishery; the industry (secondary) sector includes mining, manufacturing, energy production and supply and construction; The service (tertiary) sector refers to other industries excluding the primary and secondary sector. The FDI stock is measured by the registered capital (foreign investors) of foreign-funded enterprises in China. Data for 2012 are missing.
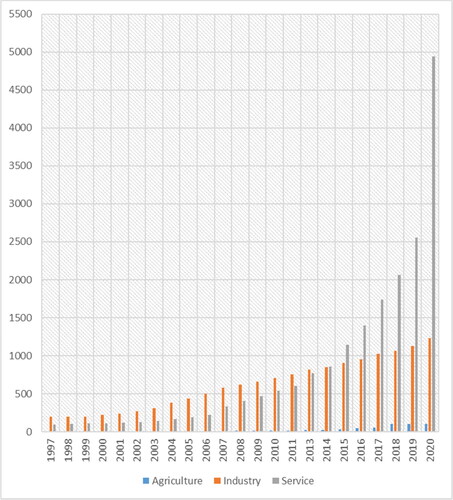
Figure 4. FDI stock by the three sectors in share of total over 1997-2020 (unit: 100%).
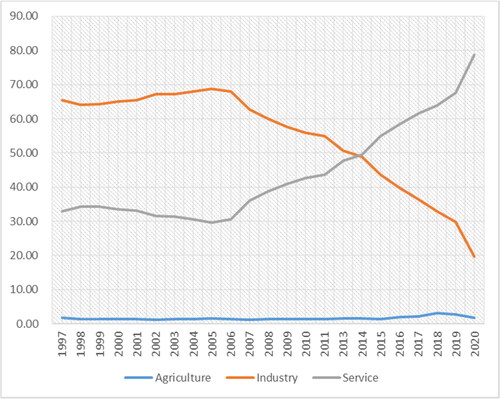
Figure 5. FDI stock in China by sector & industry as the end of 2019.
Data source: CHINA STATISTICAL YEARBOOK, National Bureau of Statistics of China
Note: The FDI stock is measured by the registered capital (foreign investors) of foreign-funded enterprises in China. ICT is abbreviation of information and communications technology (or technologies) that refers to infrastructure and components that enable modern computing.
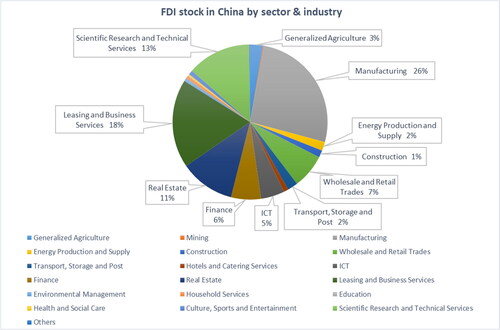
Figure 6. The share of FDI flows to China by source (unit: 100%).
Data source: STATISTICAL BULLETIN OF FDI IN CHINA, MINISTRY OF COMMERCE, PRC
Note: The nine Asian countries/regions refer to Indonesia, Japan, Macao, Malaysia, the Philippines, Singapore, Republic of Korea, Thailand and Taiwan; Main members of the EU refer to Belgium, Denmark, Germany, France, Ireland, Italy, Luxembourg, the Netherlands, Greece, Portugal, Spain, Austria, Finland, Sweden and the UK (not included in 2020 due to Brexit); Some free port areas refer to Mauritius, Barbados, Cayman Islands, British Virgin Islands, Bermuda and Samoa.
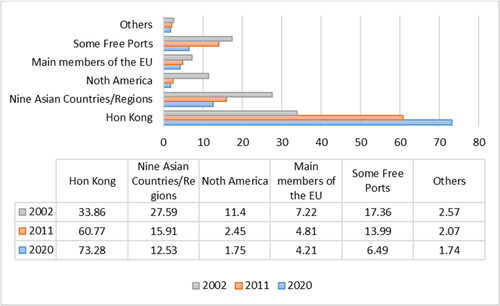
Figure 7. HK FDI flows and share of annual total in 1997-2020 (unit: billion USD; %).
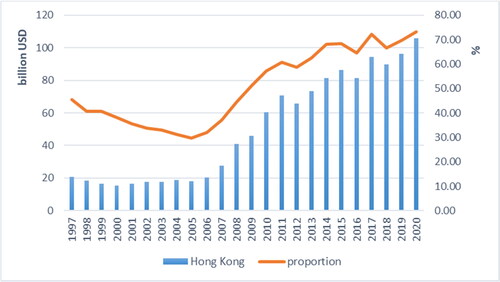
Table 1. FDI inflows by major sources (top 15) in value and share of total FDI in years of 1997, 2002, 2008, 2019 and 2020.
Figure 8. The FDI flows of major countries to China (unit: million USD).
Data source: CHINA STATISTICAL YEARBOOK, National Bureau of Statistics of China
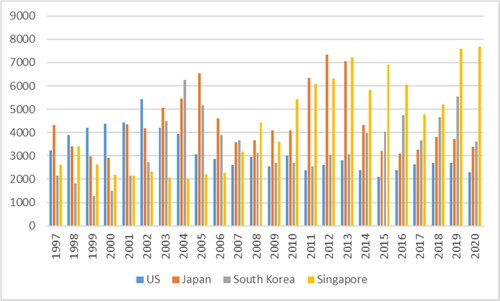
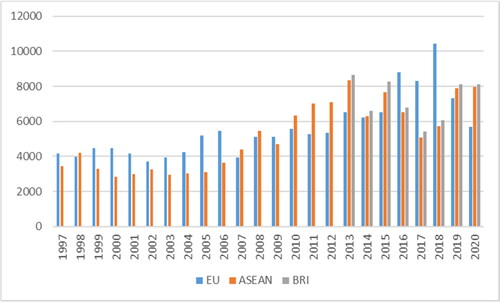
Figure 9. The FDI flows of major regional economic groups to China (unit: million USD).
Data source: STATISTICAL BULLETIN OF FDI IN CHINA, MINISTRY OF COMMERCE, PRC
Note: BRI refers to countries or regions that have joined China's Belt and Road Initiative and signed cooperation agreements.