
Figures & data
FIG 1 Anchoring DNA to the inner nuclear membrane blocks transcription-driven translocation of cohesin. (A) Schematic of cohesin translocation and blockage by membrane anchorage. Only one GFP-lacI is shown for clarity. NE = nuclear envelope. (B) Nuclear envelope tethering of DNA by GFP-FFAT-lacI. DNA circles containing an array of lac operators were generated as described in and perinuclear localization was determined for 121 G1 phase cells of strains MRG7663.1 and MRG7664, as described in Gartenberg et al.Citation35 The percentage of cells with a GFP dot in the zone closest to the nuclear envelope (the outermost of three concentric zones of equal surface area) is reported. A dashed red line identifies the expected value for random localization (33% in each zone). A representative image of MRG7664 cells is shown with SS-mCherry-HDEL tagging the NE in red. (C) Schematic of the locus used to test translocation. Binding of Mcd1-TAP was evaluated at a site labelled 5’lacO that lies immediately upstream of an array of roughly 128 lac operators. (D) Experimental flow chart. Cells were arrested in M phase by Cdc20 depletion and then URA3 transcription was induced by switching to media lacking uracil. (E) ChIP-qPCR of Mcd1-TAP. Strains MSB114 and MRG6947 were used. Values were normalized to a cohesin bound site (549.7 kb on Chr IV, see Materials and Methods). P values for pairwise Student’s t tests are presented relative to benchmark sample (designated with a dash). ns = not significant. n = number of independent biological replicates. trxn = transcription.
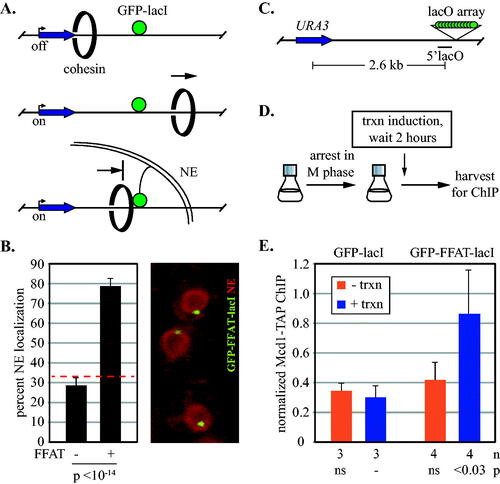
FIG 2 Synthetic barriers of sufficient size block transcription-driven translocation of cohesin. (A) Schematic of cohesin translocation and blockage by GFP-lacI chimeras. (B) Organization of the GFP-lacI chimeras with mCherries. (C) Expression of GFP-lacI chimeras. Strains MSB174, MSB179, MSB180, MSB181 and MRG7102 were used. Chimeras were immunoblotted with an antibody to GFP. The lower molecular weight bands (marked with *) likely arise from partial proteolytic cleavage of mCherry.Citation38 (D) ChIP-qPCR of Mcd1-TAP. Cohesin binding at the 5’lacO site was evaluated in strains MSB114, MRG6810, MRG6812, MSB165.1 and MRG7060 according to the growth protocol shown in . (E) ChIP-qPCR of Mcd1-TAP in a strains with an array of eight lac operators. Strains PMK11 and PMK16 were used.
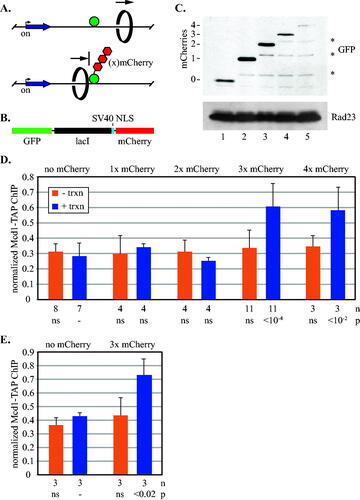
FIG 3 Synthetic barriers of sufficient size block transcription-driven translocation of cohesive cohesin. (A) An assay for cohesion at URA3. Site specific recombination in M phase converts the GFP-tagged locus into a pair of DNA circles that are visualized by fluorescence microscopy. Half-filled boxes represent RS target sites for the inducible R recombinase. (B) Experimental flow chart. Transcription was induced after M phase arrest and then DNA circles were formed by galactose-induced expression of the R recombinase. (C) Cohesion analysis of DNA circles. Strains MSB35.2, MRG6806, MRG6808, MSB167 and MRG7060 were used. P values for pairwise χ2 tests evaluate the impact of transcriptional induction for each strain. Error bars represent the standard error of proportion. n = the number of cells examined.
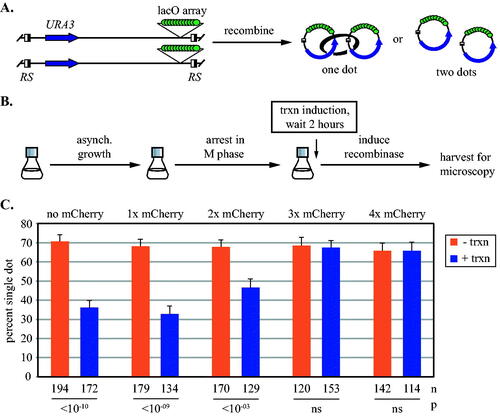
FIG 4 Synthetic barriers to cohesin translocation before and after S phase. (A) Experimental flow chart. Expression of the stable Cdk1 inhibitor Sic1(4m)-AID* was induced during an alpha factor-mediated G1 arrest. Release from the arrest caused a subsequent arrest in late G1. The AID* epitope on Sic1(4m) permitted auxin-mediated destruction of the protein, allowing resumption of growth that was arrested in the following M phase by Cdc20 depletion. Transcription was induced as indicated. Details are provided in Materials and Methods. (B) Barriers to translocation in late G1-arrested cells. ChIP-qPCR of Mcd1-TAP at 5’lacO was performed in strains MRG7027, MRG7026 and MRG7059. URA3 transcription was induced after late G1 arrest. The results were validated at a second site immediately adjacent to 5’lacO in Fig. S5A. (C) Barriers to translocation in cells progressing from G1 to M phase. URA3 was induced simultaneously with release from alpha factor arrest, thereby yielding activated transcription during late G1 arrest. The transcriptional induction was maintained for the duration of the experiment when cells were released from late G1 and rearrested in M phase. Strains MRG7033, MRG7032 and MRG7282 were used.
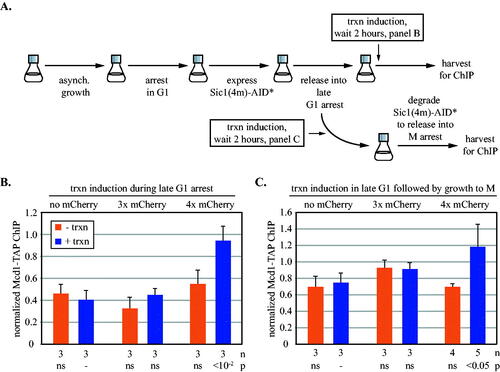
FIG 5 Transcription-driven translocation of cohesin loaded in M phase. (A) Experimental flow chart. All strains possessed a temperature-sensitive mcd1-S525N allele, as well as an ectopic, galactose inducible TAP-tagged MCD1 allele, which was expressed after cells were grown into M phase arrest at permissive temperature. Cultures were then either shifted to 37oC (panel B) or maintained at 25oC (panels C and D) before inducing URA3 transcription. See Materials and Methods for details. ChIP-qPCR was used to monitor Mcd1-TAP at 5’lacO in strains MRG7652, MRG7653 and MRG7654 (panels B and C), and mcd1-S525N-10xFLAG in strains MSB7666, MSB7667 and MSB7668 (panel D). All results were validated at a second site immediately adjacent to 5’lacO in Fig. S5B to S5D.
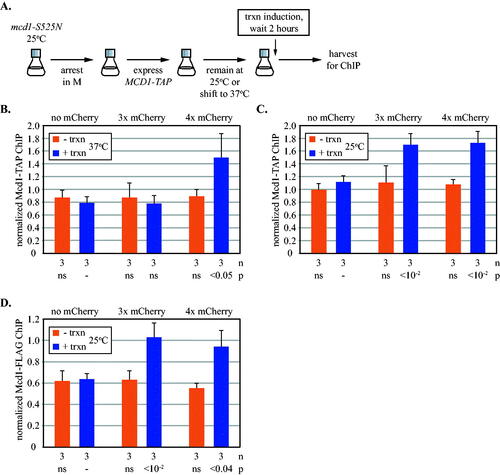
FIG 6 The impact of cohesin regulators on transcription-driven translocation past synthetic barriers. (A) Experimental flow chart. Strains with 3xmAID-tagged proteins and a no tag control were arrested in G1 with alpha factor and then treated with 100 µM NAA before release into M arrest when URA3 transcription was induced. See Materials and Methods for details. (B) Impact of cohesin regulators on cohesion of DNA circles. Cells were grown as described as in (A) except (1) DNA circles were excised following M arrest, and (2) transcription was not induced. Strains MSB203, MSB204, MSB205 and MSB206 were used. Protein depletions are signified by downward arrows above each column. P values for pairwise χ2 tests are presented relative to a wild-type. (C) Cohesin translocation in strains with no protein depletion. Strains MRG7270.1, MRG7269.1 and MRG7275.1 express OsTir1 but lack AID-tagged genes. (D) Cohesin translocation without Wpl1. Wpl1-3xmAID was depleted from strains MRG7327.1, MRG7329.1, MRG7324.1. (E) Translocation in the absence of Eco1 and Wpl1. Strains MRG7332.1, MRG7356.1 and MRG7353.1 with 3xmAID alleles of eco1 and wpl1 were used. (F) Impact of basal URA3 transcription on cohesin translocation in the absence of Eco1 and Wp1. Both proteins were depleted in strains that carried either the intact URA3 cassette (wt), a precise deletion of the URA3 promoter (Δpro) or a larger deletion that also included upstream sequences (Δpro+). See Fig. S8A for details. Accumulation of cohesin at 5’lacO was measured in media containing uracil. Strains MRG7332.1, MSB7715, MSB7710, MRG7353.1, MSB7716, and MSB7712 were used. Student’s t tests are presented separately for the sets of zero and four mCherry barriers. (G) Cohesin translocation without Eco1. Eco1-3xmAID was depleted in strains MRG7301.1, MRG7300.1, MRG7302.1. P values for pairwise Student’s t tests evaluate the impact of transcriptional induction.
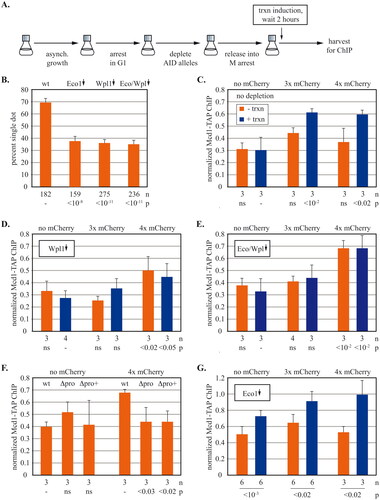
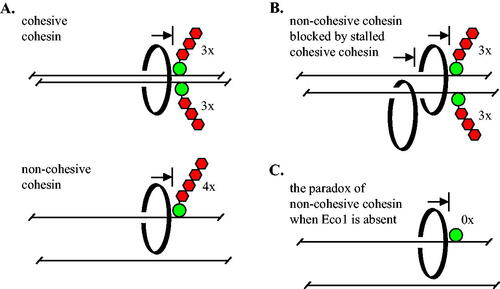
FIG 7 Barriers of sufficient size block transcription-triggered, processive movement of cohesin in vivo. (A) Cohesive cohesin cannot pass a barrier larger than three mCherries during M phase. Non-cohesive complexes translocating on a single DNA (in late G1 or M phase) cannot pass a barrier larger than four mCherries. Cohesin is depicted as a topologically-bound, black ring for simplicity. (B) Non-cohesive cohesin is blocked by cohesive cohesin that cannot pass three mCherries. (C) In the absence of Eco1 alone, cohesin cannot pass GFP-lacI, the smallest barrier that is bypassed in all other conditions.
Supplemental Material
Download Zip (16.7 MB)DATA AVAILABILITY STATEMENT
A book of Excel spreadsheets with the primary data for the figures in this study is available at Figshare https://doi.org/10.6084/m9.figshare.22551586.