
Figures & data
Figure 1. Isolated TIM23 defect in TIMM50 patient fibroblasts. (A) Depiction of the human TIM23 complex located in the inner mitochondrial membrane. TIM23 consists of core subunits TIMM23, TIMM50 and TIMM17A/B. TIM23CORE associates with accessory subunits forming either TIM23SORT for the lateral insertion of single or dual pass proteins into the inner membrane, or TIM23MOTOR for the complete translocation of proteins into the mitochondrial matrix. IMS: intermembrane space, IMM: inner mitochondrial membrane. (B) Predicted AlphaFoldCitation66,Citation67 structure (AF-Q3ZCQ8) of human TIMM50 colored according to protein domains (mitochondrial targeting sequence (MTS), transmembrane domain (TMD), FCP1-like/core domain (CORE)) and annotated with location of reported pathogenic variants as detailed in Supplementary Table 1. Variant identified in this study is denoted in red. All variants have been mapped to TIMM50 NCBI refseq protein NP_001001563.2. (C) SDS-PAGE and western blot of mitochondria isolated from fibroblast cells probing for TIM translocase subunits, using Coomassie staining as a loading control. Densitometric quantification (right) is presented as percentage of control average, normalized to Coomassie stained loading control. (D) In vitro import of 35S radiolabeled TIMM50WT and TIMM50R113C into mitochondria isolated from WT HEK293 cells in the presence (black circle) or absence (grey circle) of membrane potential (ΔΨ) dissipated with 10 μM FCCP. Following incubation for indicated times, all samples were treated with proteinase K. Coomassie staining is presented as loading control. Empty arrowhead = precursor, filled arrowhead = mature. (E) BN-PAGE and Western blot analysis of mitochondria isolated from fibroblast cells and solubilized in 1% digitonin probing for TIM translocases. Coomassie staining is presented as loading control. Densitometric quantification (below) is presented as percentage of control values, normalized to Coomassie stained loading control. (F) In vitro import of TIM23 substrate (NDUFV3) and TIM22 substrate (GC-1) into mitochondria isolated from fibroblast cells in the presence (black circle) or absence (gray circle) of membrane potential (ΔΨ) dissipated with 10 μM FCCP. Following incubation for indicated times, all samples were treated with proteinase K. Coomassie staining is presented as loading control. Empty arrowhead = precursor, filled arrowhead = mature. Quantifications (right) calculated as percentage of final control timepoint abundance normalized to Coomassie staining. (G) Gene effect scores of TIM23 subunit CRISPR knockouts in cancer cell lines (DepMap Public 23Q2 + Score, Chronos). Lower gene effect scores indicate increased likelihood of dependence in a cell line. A gene effect of −1 is the median score of all common essential genes. Essential gene status was manually curated from the DepMap portal. (H) Determination of mitochondrial protein content in whole cell proteomic data. Total label-free quantification (LFQ) values of mitochondrial proteins were summed and presented as a percentage of total LFQ values of all detected proteins within samples. (I) Quantitative proteomic volcano plot of isolated mitochondria from TIMM50 patient fibroblasts relative to controls. Labelled are significantly altered proteins involved in mitochondrial protein import pathways. (J) Translocase subunit abundance of detected proteins determined from isolated mitochondrial proteomics of fibroblast cells. Values are presented as a percentage of control averages. Data information: C, Control; P, TIMM50 Patient; R, TIMM50 Patient/TIMM50WT Rescue; FC, fold-change; CBB, Coomassie brilliant blue; IB, immunoblot. In C, E, F, H and J, data are presented as mean ± SD. *P ≤ 0.05, **P < 0.01, ***P < 0.001, ****P < 0.0001, n.s = P > 0.05. N = 3 (unpaired Student’s t test).
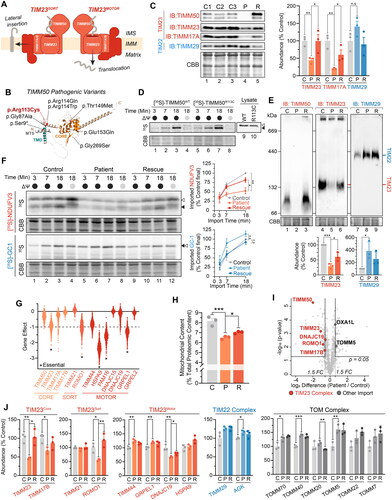
Figure 2. Combined OXPHOS deficiency in TIMM50 patient fibroblasts. (A) Relative abundance of OXPHOS complexes in fibroblast cells as determined from isolated mitochondria proteomics. Each data point represents an individual OXPHOS complex subunit. Complex abundance is calculated as the average abundance of all complex subunits. Percentage values represent complex averages. (B) Mapping of OXPHOS complex subunit fold changes (as shown in A) of TIMM50 patient fibroblasts relative to controls onto complex structures for visualization. Included below are details of complex subunit genomic source. N.D. = not detected. (C) Abundance of mtDNA encoded OXPHOS complex subunits in TIMM50 patient fibroblasts relative to controls as determined from isolated mitochondria proteomics. Each data point represents an individual OXPHOS complex subunit. Gray dots indicate subunits encoded by nuclear DNA. (D) Quantitative PCR determination of mtDNA relative to nuclear DNA (nDNA) in TIMM50 patient and control fibroblast cell lines. N = 3 subcultures (TIMM50 patient cell line) or N = 5 control cell lines. (E) Individual OXPHOS complex enzymology in TIMM50 patient fibroblasts as a percentage of citrate synthase (CS) activity. Error bars indicate range of control fibroblast values. (F and G) Oxygen consumption rate (OCR) measured in live fibroblast cells using a Seahorse XFe96 Analyzer following injection of indicated inhibitors. Control data are presented as average of 5 individual controls. Presented in G are quantifications of basal (prior to oligomycin treatment) and maximal mitochondrial OCR (following FCCP treatment). (H) BN-PAGE of mitochondria isolated from control and TIMM50 patient fibroblast cells solubilized in 1% digitonin and probed for OXPHOS complexes as indicated. Coomassie staining is presented as loading control. Densitometric quantification for total lane intensity (below) is presented as percentage of control values, normalized to Coomassie staining loading control. Data information: C, Control; P, TIMM50 Patient; R, TIMM50 Patient/TIMM50WT Rescue; CBB, Coomassie brilliant blue; IB, immunoblot. In A, D, F, G, and H, data are presented as mean ± SD. *P ≤ 0.05, **P < 0.01, ***P < 0.001, ****P < 0.0001, N = 3 (For A: paired Student’s t test, For G and H: unpaired Student’s t test). In (E), error bars indicate range of control values.
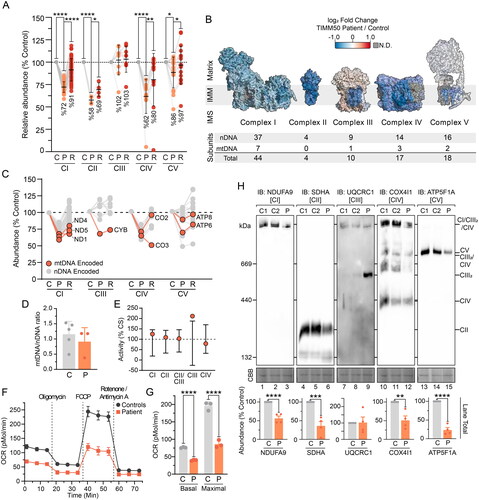
Figure 3. Compromised inner membrane integrity with pathogenic variants in TIMM50. (A) Immunoblotting and in-gel activity of complex V assessed via BN-PAGE and SDS-PAGE of mitochondria isolated from control and TIMM50 patient fibroblast cells. BN-PAGE samples were solubilized in 1% digitonin. “IB: As Above” indicates usage of the same antibody on BN-PAGE as on SDS-PAGE. Coomassie staining was used as a loading control for BN-PAGE. GC1 was used as a loading control for SDS-PAGE. (B) Mapping of complex V subunit fold changes (as shown in ) onto the structure of dimerized complex V (PDB: 7AJD). Labelled are significantly affected subunits, relevant subunits for immunoblotting in , and subcomplex regions. N.D. = not detected. (C) BN-PAGE of mitochondria isolated from fibroblast cells and solubilized in 1% digitonin. Coomassie staining is presented as loading control. Densitometric quantification (right) is presented as percentage of control values, normalized to Coomassie staining loading control. (D) Relative abundance of mitochondrial complexes in fibroblast cells as determined from isolated mitochondria proteomics. Each data point represents an individual complex subunit. Complex abundance is calculated as the average abundance of all complex subunits. Percentage values represent complex averages. (E) Confocal microscopy of fibroblasts immunostained for mitochondria (NDUFAF2, mitochondrial matrix) and mitochondrial DNA (TFAM). Nucleus was stained with Hoechst. Scale bars = 10 μm, Inset shows enlargement of boxed area. (F) Immunofluorescence confocal microscopy of fibroblasts fixed with paraformaldehyde. Nuclei were stained with DAPI and mitochondria with mitochondrial matrix protein NDUFAF2. Immunostaining of TFAM was used for mtDNA visualization. Data information: C, Control; P, TIMM50 Patient; R, TIMM50 Patient/TIMM50WT Rescue; CBB, Coomassie brilliant blue; Exp, exposure; IB, immunoblot. In C and D, data are presented as mean ± SD. *P ≤ 0.05, **P < 0.01, ***P < 0.001, ****P < 0.0001, N = 3 (For C: unpaired Student’s t test, For D: paired Student’s t test).
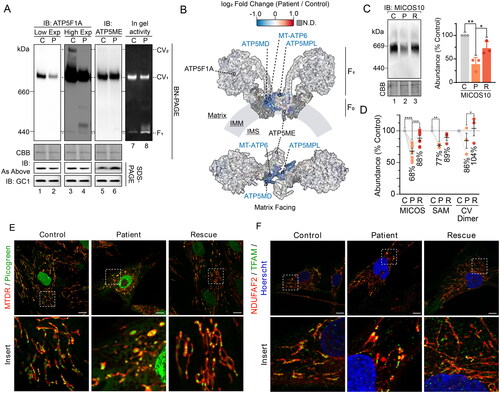
Figure 4. HEK293 models recapitulate mitochondrial defects. (A) Cell line generation and identities for HEK293 cell models of TIMM50 dysfunction. (B) SDS-PAGE of mitochondria isolated from HEK293 cells subjected to CRISPR-Cas9 gene disruption of TIMM50 and re-expression of WT TIMM50, probing for TIM translocase subunits. Coomassie staining is presented as loading control. Densitometric quantification (right) is presented as percentage of control average, normalized to Coomassie staining loading control. (C) BN-PAGE of mitochondria isolated from HEK293 cells solubilized in 1% digitonin probing for TIM translocase. Coomassie staining is presented as loading control. Densitometric quantification (below) is presented as percentage of control values, normalized to Coomassie staining loading control. (D) Quantitative proteomics volcano plot of isolated mitochondria from HEK293 TIMM50MUT cells relative to WT controls. Labelled are significantly altered proteins involved in mitochondrial protein import. (E) Relative abundance of OXPHOS complexes in HEK293 cells as determined from whole cell proteomics. Each data point represents an individual OXPHOS complex subunit. Complex abundance is calculated as the average abundance of all complex subunits. Percentage values represent complex averages compared to controls. (F) BN-PAGE of mitochondria isolated from HEK293 cells solubilized in 1% digitonin probing for OXPHOS complexes. Coomassie staining is presented as loading control. Densitometric quantification (below) is presented as percentage of control values, normalized to Coomassie staining loading control. (G and H) Oxygen consumption rate (OCR) measured in live HEK293 cells using a Seahorse XFe96 Analyzer following injection of indicated inhibitors. Presented in H are quantifications of basal (prior to oligomycin treatment) and maximal mitochondrial OCR (following FCCP treatment). (I) Radiolabeling of mitochondrial translation products in HEK293 cells performed by pulsing with [35S]-Met/Cys for 2 h in the presence of the cytosolic translation inhibitor anisomycin followed by a chase for the indicated times. Isolated mitochondria were analyzed by SDS-PAGE and autoradiography. Coomassie staining is presented as a loading control. (J) BN-PAGE of mitochondria isolated from HEK293 cells and solubilized in 1% digitonin. Coomassie staining is presented as loading control. Densitometric quantification (below) is presented as percentage of control values, normalized to Coomassie staining loading control. (K) Confocal microscopy of HEK293 immunostained for mitochondria (NDUFAF2, mitochondrial matrix) and mitochondrial DNA (TFAM). Nuclei were stained with Hoechst. Inset shows enlargement of boxed area, scale bar = 10 μm. Data information: C, WT HEK293 Control; M, HEK TIMM50MUT; R, TIMM50MUT/TIMM50 rescue; CBB, Coomassie brilliant blue; FC, fold change; IB, immunoblot. In B, C, E–H, and J, data are presented as mean ± SD. *P ≤ 0.05, **P < 0.01, ***P < 0.001, ****P < 0.0001, N = 3 (For B, C, D, H and J: unpaired Student’s t test, For E: paired Student’s t test).
![Figure 4. HEK293 models recapitulate mitochondrial defects. (A) Cell line generation and identities for HEK293 cell models of TIMM50 dysfunction. (B) SDS-PAGE of mitochondria isolated from HEK293 cells subjected to CRISPR-Cas9 gene disruption of TIMM50 and re-expression of WT TIMM50, probing for TIM translocase subunits. Coomassie staining is presented as loading control. Densitometric quantification (right) is presented as percentage of control average, normalized to Coomassie staining loading control. (C) BN-PAGE of mitochondria isolated from HEK293 cells solubilized in 1% digitonin probing for TIM translocase. Coomassie staining is presented as loading control. Densitometric quantification (below) is presented as percentage of control values, normalized to Coomassie staining loading control. (D) Quantitative proteomics volcano plot of isolated mitochondria from HEK293 TIMM50MUT cells relative to WT controls. Labelled are significantly altered proteins involved in mitochondrial protein import. (E) Relative abundance of OXPHOS complexes in HEK293 cells as determined from whole cell proteomics. Each data point represents an individual OXPHOS complex subunit. Complex abundance is calculated as the average abundance of all complex subunits. Percentage values represent complex averages compared to controls. (F) BN-PAGE of mitochondria isolated from HEK293 cells solubilized in 1% digitonin probing for OXPHOS complexes. Coomassie staining is presented as loading control. Densitometric quantification (below) is presented as percentage of control values, normalized to Coomassie staining loading control. (G and H) Oxygen consumption rate (OCR) measured in live HEK293 cells using a Seahorse XFe96 Analyzer following injection of indicated inhibitors. Presented in H are quantifications of basal (prior to oligomycin treatment) and maximal mitochondrial OCR (following FCCP treatment). (I) Radiolabeling of mitochondrial translation products in HEK293 cells performed by pulsing with [35S]-Met/Cys for 2 h in the presence of the cytosolic translation inhibitor anisomycin followed by a chase for the indicated times. Isolated mitochondria were analyzed by SDS-PAGE and autoradiography. Coomassie staining is presented as a loading control. (J) BN-PAGE of mitochondria isolated from HEK293 cells and solubilized in 1% digitonin. Coomassie staining is presented as loading control. Densitometric quantification (below) is presented as percentage of control values, normalized to Coomassie staining loading control. (K) Confocal microscopy of HEK293 immunostained for mitochondria (NDUFAF2, mitochondrial matrix) and mitochondrial DNA (TFAM). Nuclei were stained with Hoechst. Inset shows enlargement of boxed area, scale bar = 10 μm. Data information: C, WT HEK293 Control; M, HEK TIMM50MUT; R, TIMM50MUT/TIMM50 rescue; CBB, Coomassie brilliant blue; FC, fold change; IB, immunoblot. In B, C, E–H, and J, data are presented as mean ± SD. *P ≤ 0.05, **P < 0.01, ***P < 0.001, ****P < 0.0001, N = 3 (For B, C, D, H and J: unpaired Student’s t test, For E: paired Student’s t test).](/cms/asset/429576af-35f5-470d-ae0d-858974b20cfb/tmcb_a_2353652_f0004_c.jpg)
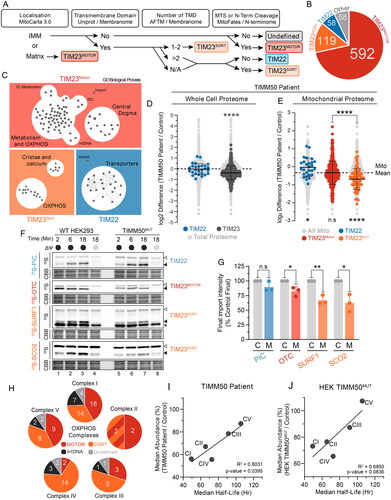
Figure 5. Mitochondrial pathways with increased TIM23SORT dependence are most impacted by loss of TIMM50. (A) Pipeline for import pathway annotation of inner membrane and matrix proteins. Gene list of inner membrane and matrix proteins according to MitoCarta 3.0 (excluding mtDNA encoded proteins) were annotated with the following datasets; Uniprot, predicted transmembrane domain; Membranome, predicted transmembrane domain; AFTM, predicted number of transmembrane domains; Membranome, bitopic; MitoFates, mitochondrial targeting sequence prediction; N-terminome, presence of cleaved n-terminal sequence. Thresholds for each group were as follows; Transmembrane Domain, yes in either database; Number of transmembrane domains, prioritized Membranome bitopic; MTS or N-Term Cleavage, MitoFates score > 0.250 or presence of n-terminal cleavage. Following annotation, substrates predicted to be OXA1L substrates were manually re-assigned. (B) Breakdown of proteins assigned to each import pathway annotation. (C) Enrichment maps of GO biological process terms from import pathway annotation data sets with false discovery rate of less than 0.05. Each dot represents an enriched GO biological process with lines indicating common genes shared across GO biological process gene sets. (D) Fold-change values of mitochondrial proteins grouped according to predicted import pathways in TIMM50 patient fibroblasts relative to controls in whole cell proteomics data set. Light gray dots represent the distribution of the total cellular proteome. Statistical significance indicates import pathway substrate means relative to the total cell proteome mean. (E) Fold-change values of mitochondrial proteins grouped according to predicted import pathways in TIMM50 patient fibroblasts relative to controls in whole cell proteomics data set. Light gray dots represent the distribution of the total mitochondrial proteome with the mitochondrial mean indicated. Bottom: Statistical significance of import pathway substrate means relative to the mitochondrial mean. Top: Statistical significance represents comparison of means between import pathway substrate groups. (F and G) In vitro import of TIM22 (PiC), TIM23MOTOR (OTC) and TIM23SORT (SURF1 and SCO2) substrates into mitochondria isolated from HEK293 cells in the presence (black circle) or absence (gray circle) of membrane potential (ΔΨ) dissipated with 10 μM FCCP. Following incubation for indicated times, all samples were treated with proteinase K. Coomassie staining is presented as loading control. Empty arrowhead = precursor, filled arrowhead = mature. Quantifications (right) calculated as percentage of final control timepoint abundance normalized to Coomassie staining. (H) Pie charts of OXPHOS complexes according to determined import pathway. Multicolored complex II section represents SDHC and SDHD which are imported via a combined TIM23 SORT-MOTOR-OXA1L import pathway. (I and J) Correlation of OXPHOS complex median abundance with median half-life in either TIMM50 patient fibroblasts (G) or TIMM50MUT HEK293 (H) cells relative to controls. Abundance data were collected from whole cell proteomics dataset. Solid line represents linear regression. Data information: C, WT HEK293 Control; M, HEK TIMM50MUT. In D–G, data are presented as mean ± SD. *P ≤ 0.05, **P < 0.01, ***P < 0.001, ****P < 0.0001, N = 3 (unpaired Student’s t test).
Supplemental Material
Download Zip (6.5 MB)Data availability statement
The data sets produced in this study are available in the following databases: Quantitative proteomic MSMS data: PRIDE PXD047774 (http://www.ebi.ac.uk/pride/archive/projects/ PXD047774)