
Figures & data
Figure 1. SHP-1 interacts with PPARγ mainly through the SH2 domains. (A) NIH3T3 cells were transfected with the indicated plasmids and were either treated with DMSO or 100 nM rosiglitazone for 1 h. Cell lysates were immunoprecipitated using anti-FLAG M2 beads. The expression of respective proteins was determined by western blot analysis using the indicated antibodies (representative of two independent experiments). (B) Quantification of immunoprecipitated Myc-PPARγ2 and FLAG-SHP-1 was performed by densitometry using ImageJ (N = 2). (C) Schematic representation of various SHP-1 constructs generated via recombinant DNA technology. (D) HepG2 cells were transfected with the indicated plasmids and cell lysates were immunoprecipitated using anti-FLAG M2 beads. The expression of respective proteins was determined by western blot analysis using the indicated antibodies (representative of two independent experiments). (E) Quantification of immunoprecipitated Myc-PPARγ2 and FLAG-SHP-1 constructs was performed by densitometry using ImageJ software (N = 2). (F) HepG2 cells were transfected with the indicated plasmids and cell lysates were immunoprecipitated using anti-FLAG M2 beads. The expression of respective proteins was determined by western blot analysis using the indicated antibodies (representative of three independent experiments). (G) Quantification of immunoprecipitated Myc-PPARγ2 and GFP-FLAG3 SH2 domain constructs was performed by densitometry using ImageJ software (N = 3). IP: immunoprecipitation, WCE: whole cell extracts.
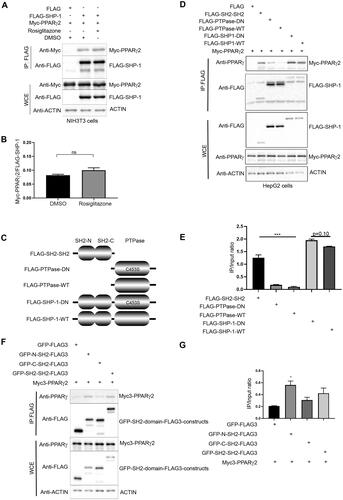
Figure 2. SHP-1 dephosphorylates PPARγ2 in vitro. (A) HEK293T cells were transfected with an empty FLAG-vector or a FLAG-PPARg2 plasmid. After 24 h cells were treated with bpV(HOpic) (20 μM) for 30 min. Lysates were immunoprecipitated with anti-FLAG beads and analyzed by western blot analysis using respective antibodies. IP: immunoprecipitation, WCE: whole cell extracts, 4G10/PY20: mix of phosphotyrosine-specific antibodies (N = 3). (B) HEK293T cells were transfected with FLAG empty vector, FLAG-SHP-1-WT, FLAG-SHP-1-DN or Myc-PPARg2 plasmids. After 24 h cells were either left untreated or treated with 20 µM bpV(HOpic) for 30 min. Myc-precipitated, tyrosine-phosphorylated Myc-PPARγ2 was used as substrate and incubated for 30 min at 37 °C with FLAG, FLAG-SHP-1-WT or FLAG-SHP-1-DN eluted from FLAG-beads after FLAG-precipitation or with recombinant λ phosphatase. Tyrosine-phosphorylation of Myc-PPARγ2 was determined by western blot analysis using phosphotyrosine-specific antibodies to measure SHP-1 activity. The expression of respective Myc- and FLAG-constructs was verified by immunoblotting of whole cell extracts with the indicated antibodies (WT: wild-type, DN: dominant negative). (Representative of three independent experiments.) (C) Quantification of levels of phosphotyrosine Myc-PPARγ2 and total Myc-PPARγ2 was performed by densitometry using ImageJ software (N = 3). (D) NIH3T3 cells were either transfected with V5 empty vector, PTP1B-V5, SHP-1-V5 or FLAG-PPARg2 constructs. After 24 h cells were either left untreated or treated with 20 µM bpV(HOpic) for 30 min. FLAG-PPARγ2 eluted from FLAG-agarose beads was used as substrate and incubated with V5-precipitated V5, PTP1B-V5 or SHP-1-V5 at 37 °C for 30 min. Tyrosine-phosphorylation of FLAG-PPARγ2 was determined by western blotting using phospho-tyrosine specific antibodies to measure PTP1B and SHP-1 activity. The expression of respective V5- and FLAG-constructs was verified by immunoblotting of whole cell extracts with the indicated antibodies. (Representative of three independent experiments.) (E) Quantification of levels of phospho-tyrosine FLAG-PPARγ2 and total FLAG-PPARγ2 was performed by densitometry using ImageJ software (N = 3). (F) V5, SHP-1-V5 or PTP1B-V5 immunoprecipitates were incubated with DiFMUP (6,8-difluoro-4-methylumbelliferyl phosphate) substrate. Reaction was performed at 37 °C for 30 min. Phosphatase activity was assessed by measuring fluorescence at 455 nm (setting: Ex 358/Em 455) (N = 2). IP: immunoprecipitation, WCE: whole cell extracts.
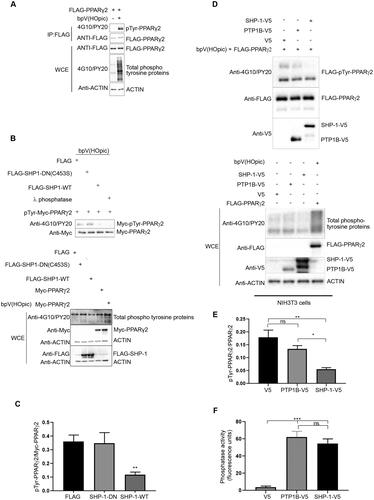
Figure 3. CD36 and FABP4 transcript levels are increased in NIH3T3, but not HepG2 cells in response to rosiglitazone treatment after overexpression of PPARγ2. (A, C) HepG2 cells and (B, D). NIH3T3 cells were transfected with either FLAG empty vector or FLAG-PPARg2. After 24 h cells were treated either with DMSO or rosiglitazone (100 nM) for 16 h. Expression of indicated proteins was determined by western blot analysis (A and B) using respective antibodies. The amounts of CD36 and FABP4 transcripts were evaluated by qPCR (C and D) (N = 3).
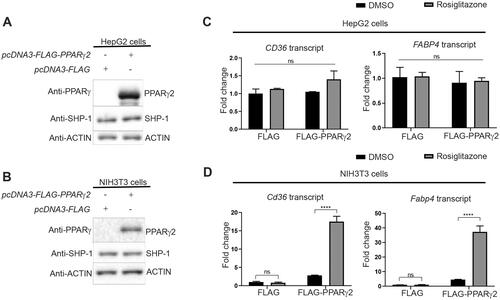
Figure 4. SHP-1 modulates PPARγ2 stability. (A) NIH3T3 cells were infected with retrovirus encoding empty vector (MSCV) or Pparg2. In addition, cells were transduced with lentivirus containing shRNA-control (Luc) or shRNA-Ptpn6. The expression of the indicated proteins was determined by western blotting. (B) Quantification of PPARγ2 amounts was performed by densitometry using ImageJ software (N = 3). (C) Pparg2 transcript levels were quantified by qPCR (N = 3). (D) NIH3T3 cells overexpressing Pparg2 in SHP-1-WT (shRNA Luc) and SHP-1-KD (shRNA Ptpn6) background were treated with cycloheximide (CHX) for the indicated times. The expression of respective proteins was determined by western blotting (N = 2). (E) Quantification of PPARγ2 levels was performed by densitometry using ImageJ software (N = 2).
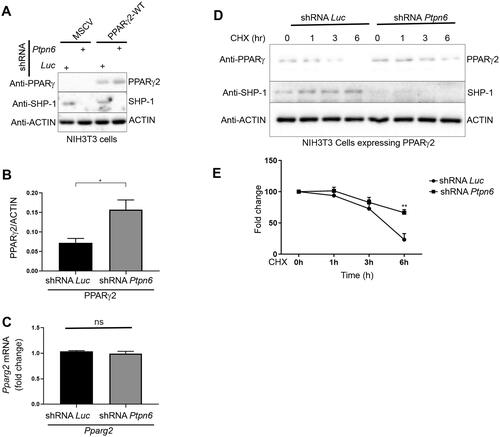
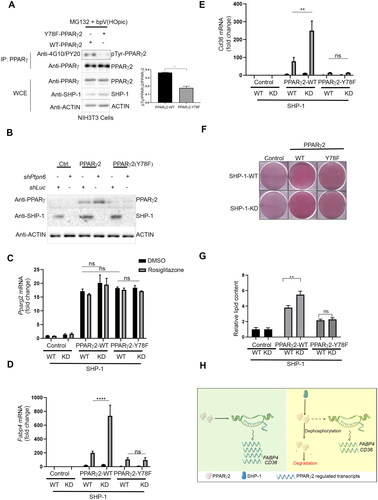
Figure 5. SHP-1 regulates PPARγ2-mediated adipogenesis through tyrosine residue 78. (A) NIH3T3 cells overexpressing Pparg2 and Pparg2 (Y78F) in SHP-1-WT background were treated with 20 µM MG132 for 1 h. During the last 30 min of MG132 incubation, cells were treated with 20 µM of bpV(HOpic). Protein lysates were prepared and immune-precipitated using a PPARγ-specific antibody. Expression of indicated proteins was determined by western blot analysis using respective antibodies (N = 2). (B) Knockdown (KD) of SHP-1 in NIH3T3 cells stably expressing PPARγ2-WT or PPARγ2-Y78F using lentiviral-mediated shRNA transduction. Expression of indicated proteins was confirmed by western blot analysis (N = 2). (C–E) mRNA levels of Pparg2 (C), Fabp4 (D) and Cd36 (E) were determined by qPCR in NIH3T3 SHP-1-WT or -KD cells stably transduced with empty vector (Control), PPARγ2-WT or -Y78F. Cells were treated with either DMSO or 100 nM rosiglitazone for 16 h (N = 3). (F) NIH3T3 cells with or without knockdown of SHP-1 stably expressing either control retroviral vector, PPARγ2-WT or -Y78F were cultured to confluence and then treated with rosiglitazone (100 nM). On day 10, cells were fixed and lipid content was determined by oil red O staining. (G) Quantification of oil red O-staining from cells shown in . Oil red O-stained NIH3T3 cells were dissolved in isopropanol and intracellular lipid content was quantified by measuring absorbance at 500 nm (N = 3). (H) Model depicting the control of PPARγ2 activity by SHP-1. This figure was partly generated using Servier Medical Art (https://smart.servier.com), provided by Servier, licensed under a Creative Commons Attribution 3.0 unported license.
Supplemental Material
Download MS Word (1.4 MB)Data availability statement
The data that support the findings of this study are openly available in figshare: https://figshare.com/articles/figure/Source_Files_Kumar_et_al_MCB_2024/25772886.