
Figures & data
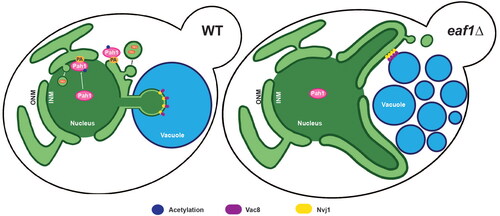
Figure 1. Deletion of EAF1 results in nuclear deformation and vacuole fragmentation. (A) Simplified diagram of yeast lipid synthesis showing the diversion of phosphatidic acid (PA) into two main pathways; one producing lipid droplets, and the other producing membrane phospholipids (PS, phosphatidylserine. PE, phosphatidylethanolamine. PC, phosphatidylcholine. PI, phosphatidylinositol). DAG, diacylglycerol. TAG, triacylglycerol. CDP-DAG, cytidine diphosphate diacylglycerol. G-6-P, glucose-6-phosphate. (B) Representative images showing nuclear deformation and vacuole fragmentation in WT and eaf1Δ cells expressing ACS2-GFP, NUP49-RFP (YKB 4972 and YKB 4863) and stained with CMAC. 3D reconstruction of cells was done using Imaris software. Scale bar = 5 μm. Images presented are representative of three biological replicates. (C) Proportion of total cells with deformed nuclei was quantified through visual analysis of cells. This was repeated for three biological replicates, counting at least 100 cells for each. (D) Proportion of total cells with fragmented vacuoles (i.e. having five or more vacuolar lobes), was quantified by visually counting the number of vacuoles per cell. Gray dots represent three biological replicates of at least 100 cells for each. Horizontal bars represent the mean. For C and D, an ANOVA analysis was performed using Tukey’s multiple comparison test. *P ≤ 0.05, ***P ≤ 0.001, ****P < 0.0001. Relevant statistical significance bars are shown, additional comparisons can be found in Supplemental Table 1.
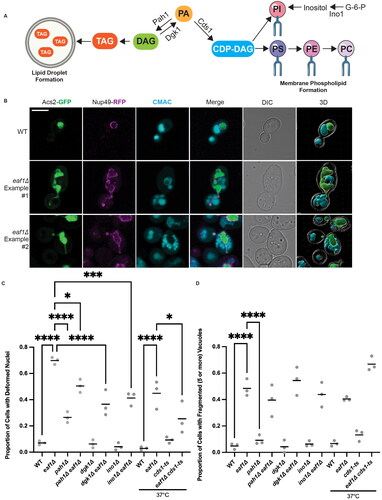
Figure 2. Loss of Pah1 at the INM upon deletion of EAF1, with no change in nuclear phosphatidic acid (PA) and INM diacylglycerol (DAG). (A) Schematic diagram for a bifluorescent complementation assay (BiFC) shows the interaction between two protein fragments, each encoding half of the Venus fluorescent protein. Upon interaction, they form the whole Venus that can be visualized using a fluorescence microscope. (B) Pah1 INM localization is dependent on EAF1. BiFC experiment with WT or eaf1Δ cells expressing Pah1-VC and Nup60-VN (YKB 4977 and YKB 4978) or Pus1-VN (YKB 4975 and YKB 4976) was assessed. Scale bar = 5 μm. (C) Live imaging of WT and eaf1Δ cells expressing genomically integrated ASC2-GFP and the plasmid-based NLS-Q2-mCherry biosensor (YKB 5182 and YKB 5183) (top panel) or NLS-DAG-mCherry biosensor (YKB 5184 and YKB 5185) (bottom panel) and stained with CMAC to mark the vacuoles. Scale bar = 5 μm. Images presented are representative of three biological replicates. Line graphs for (B) and (C) were generated by measuring the fluorescence intensity value of pixels across the nucleus of the cell, using Plot Profile in ImageJ software. Red/black lines indicate the average for the indicated number of cells, and the grey lines show each cell profile. n = the number of randomly selected cells. FU = fluorescence units. *Indicates that that y-axis has been cropped to facilitate comparison of strains.
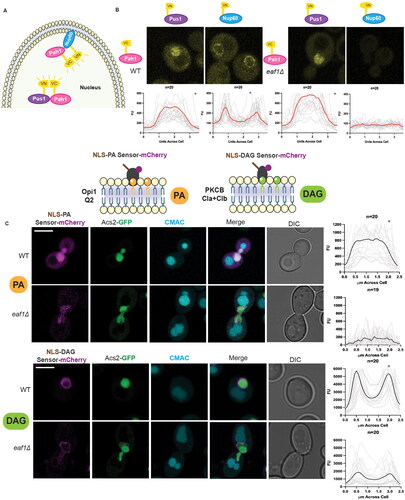
Figure 3. Targeting Pah1 to the nuclear membrane with Pah1-7A-GFP rescues nuclear deformation and vacuole fusion defects. (A) Graphic depicting the interaction of Pah1-7A and Pah1-7A-AH3A with the nucleus/nuclear ER (NER). (B) Merged Z-stack images showing WT and eaf1Δ Pah1-7A-GFP (YKB 5198 and YKB 5199) as well as WT and eaf1Δ Pah1-7A-AH3A-GFP (YKB 5200 and YKB 5201), with Nab2-NLS mCherry to visualize the nucleus, and the vacuole stained with CMAC. Scale bar = 5 μm. Images presented are representative of three biological replicates. (C) Proportion of cells with deformed nuclei. Cells were quantified by observing a nuclear extension versus a round nuclei. (D) Proportion of cells with fragmented (five or more) vacuoles. Cells were quantified by visually counting the number of vacuoles per cell. For C and D, an ANOVA analysis was performed using Tukey’s multiple comparison test. Cells were counted by investigating the full Z-stack of cells. Grey dots represent three biological replicates of at least 100 cells for each. Horizontal bars represent the mean. *P ≤ 0.05, **P ≤ 0.01, ***P ≤ 0.001, ****P < 0.0001, ns = not significant, P > 0.05.
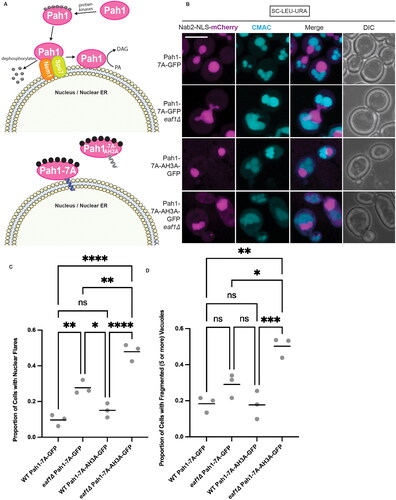
Figure 4. Deletion of EAF1 results in a decrease in nuclear vacuole junction (NVJ) formation. (A) Graphic depicting the proteins and complex lipid metabolism that occurs at the NVJ. (B) Nitrogen starvation-induced NVJs are reduced in eaf1Δ cells. WT and eaf1Δ cells expressing genomically integrated NVJ1-RFP (YKB 5123 and YKB 5134) were grown to log phase in YPD at 30 °C prior to shifting into nitrogen starvation (NS) media for 4 h and staining with CMAC to visualize vacuoles. Images presented are representative of three biological replicates of at least 200 cells counted for each. Scale bar = 5 μm. (C) Proportion of cells with an NVJ, counted visually by assessing the presence or absence of Nvj1-RFP punctae within the cell. (D) The length of the NVJ was measured using a line tool on ImageJ. 20 cells were measured for each strain and performed in triplicate. For both C and D, ANOVA analysis was performed using Tukey’s multiple comparison test. Gray and purple dots represent three biological replicates. Horizontal bars represent the mean. ****P < 0.0001, ns = not significant, P > 0.05. Relevant statistical significance bars are shown, additional comparisons can be found in Supplemental Table 1.
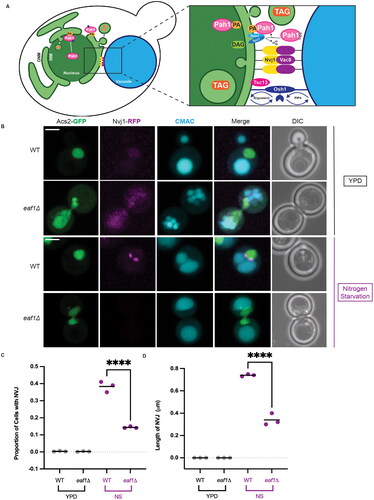
Figure 5. Deletion of EAF1 results in decreased piecemeal microautophagy of the nucleus (PMN). (A) WT and eaf1Δ cells (YKB 5186 and YKB 5187) with Nab2-NLS-mCherry to visualize the nucleus and CMAC staining the vacuole. Cells were grown to log phase in nutrient-rich media and then transferred into nitrogen starvation media. Merged Z-stack images show the formation of PMN structures, indicated by a white arrow, following 4 h of nitrogen starvation. 3D projection of Z-stacks using Imaris software shows PMN blebs entering the vacuole in WT cells. In eaf1Δ cells with nuclear extensions wrapping around or between vacuolar lobes were detected. Scale bar = 5 μm. Arrows indicate presence of a PMN bleb entering the vacuole. (B) Cells were grown in either YPD or switched to nitrogen starvation (NS) media for 4 h. The proportion of cells with PMN were carefully counted by investigating the full Z-stack of cells. If there was a clear bleb of Nab2-NLS mCherry that entered the vacuole, a cell was counted as having PMN. Under nitrogen starvation, eaf1Δ cells have a significant reduction in PMN compared to WT. ANOVA analysis was performed using Tukey’s multiple comparison test. Gray and purple dots represent three biological replicates, counting at least 200 cells for each. Horizontal bars represent the mean. Relevant statistical significance bars are shown, additional comparisons can be found in Supplemental Table 1. ****P < 0.0001, ns = not significant, P > 0.05. (C) WT and eaf1Δ cells expressing a GFP-Rosella construct fused to the nuclear localization signal from Nab35 (YKB 5188 and YKB 5189), were grown to mid-log phase and switched to nitrogen starvation media for 24 h prior to imaging. Arrows highlight Rosella signal in the vacuole, indicating active PMN. Scale bar = 5 μm.
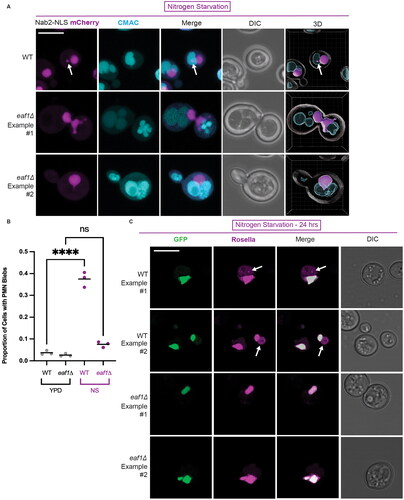
Figure 6. Mutations at Pah1-K496 result in a loss of Pah1-VC interaction with Pus1-VN and Nup60-VN. BiFC interaction between Pah1-K496Q-VC, Pah1-K496R-VC, Pah1-K801Q-VC, and Pah1-K801R-VC with both Nup60-VN (on left) and Pus1-VN (on right) (YKB 5206–YKB 5213) were visualized using fluorescence microscopy. Scale bar = 5 μm. Line graphs were generated by measuring the fluorescence intensity value of pixels across the nucleus of the cell using Plot Profile in ImageJ software. The gray lines show individual cell profiles and the red line indicate the average across all measured cells. n = the number of randomly selected cells. FU = fluorescence units. *Indicates that that y-axis has been cropped for easy comparison of strains.
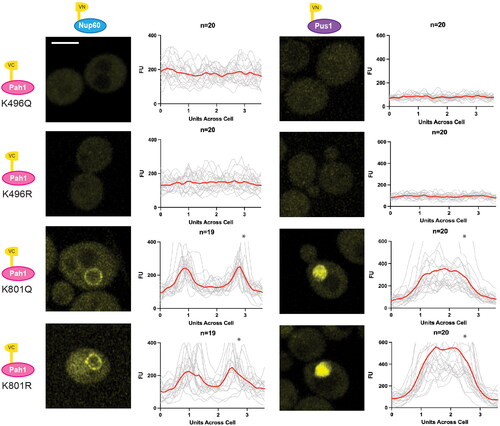
Figure 7. Pah1-K496 confers changes in Pah1 localization. (A) Single sliced Z-stack images showing Pah1-3xGFP localization, and vacuoles labeled with CMAC in the WT PAH1-3xGFP (YKB 4993), eaf1Δ PAH1-3xGFP (YKB 4994), PAH1-K496Q-3XGFP (YKB 5130) and PAH1-K496R-3XGFP (YKB 5131) strains. Scale bar = 5 μm. (B) Dot assays showing growth of WT PAH1-3xGFP (YKB 4993), eaf1Δ PAH1-3xGFP (YKB 4994), PAH1-K496Q-3XGFP (YKB 5130) and PAH1-K496R-3XGFP (YKB 5131) after a period of 48 h at 25 °C.
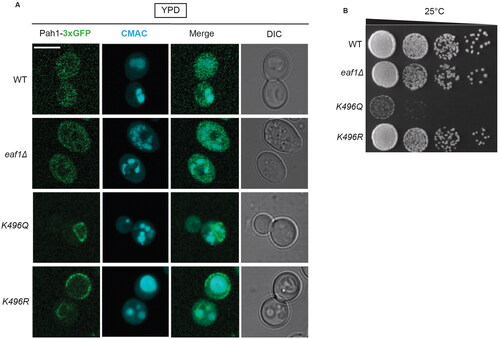
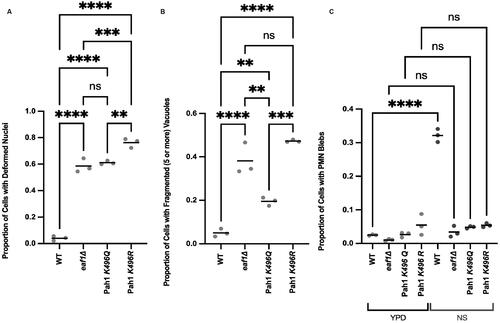
Figure 8. Pah1-K496 mutation results in increased nuclear deformation, vacuole fragmentation and defects in piecemeal microautophagy of the nucleus. (A) Proportion of WT (YKB 5190), eaf1Δ (YKB 5191), PAH1-K496Q (YKB 5192), and PAH1-K496R (YKB 5193) cells expressing Pah1-3xGFP and Nab2-NLS-mCherry were accessed for nuclear deformation. (B) Proportion of cells with fragmented (five or more) vacuoles quantified by visually counting the number of vacuoles per cell. (C) Proportion of cells with PMN blebs. Cells were grown in either YPD or switched to nitrogen starvation (NS) media for 4 h. If there was a clear bleb of Nab2-NLS mCherry that entered the vacuole, a cell was counted as having PMN. For A, B and C, an ANOVA analysis was performed using Tukey’s multiple comparison test. Cells were counted by investigating the full Z-stack of cells. Dots represent three biological replicates of at least 100 cells for each. Horizontal bars represent the mean. **P ≤ 0.01, ***P ≤ 0.001, ****P < 0.0001, ns = not significant, P > 0.05. Relevant statistical significance bars are shown, additional comparisons can be found in Supplemental Table 1.
Supplemental Material
Download Zip (14.5 MB)Data availability statement
Supplemental Videos and raw figure data are available on Figshare: https://figshare.com/s/0448d63faeb05ded3d0b (DOI: 10.6084/m9.figshare.25576950). Additional data is available upon request to corresponding authors.